Estimated Value: $132,000 - $156,000
3
Beds
1
Bath
912
Sq Ft
$161/Sq Ft
Est. Value
About This Home
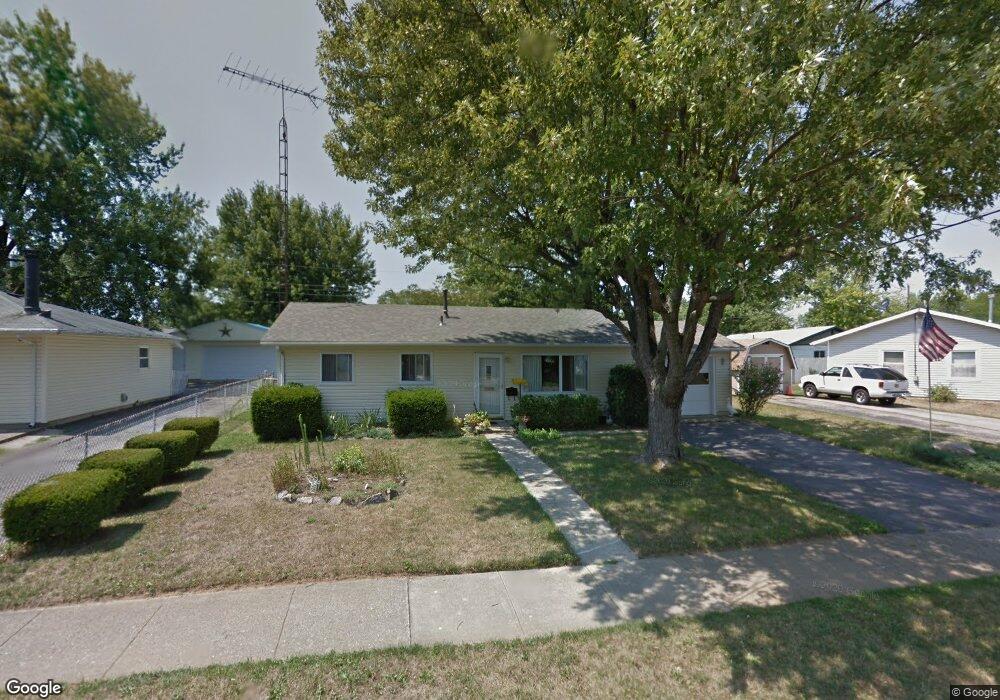
This home is located at 224 Sheelin Rd, Xenia, OH 45385 and is currently estimated at $146,655, approximately $160 per square foot. 224 Sheelin Rd is a home located in Greene County with nearby schools including Xenia High School, Summit Academy Community School for Alternative Learners - Xenia, and Legacy Christian Academy.
Ownership History
Date
Name
Owned For
Owner Type
Purchase Details
Closed on
Dec 12, 2019
Sold by
Dwyane Gallogly and Dwyane Laura Gallogly
Bought by
Deer Run Investment Llc
Current Estimated Value
Home Financials for this Owner
Home Financials are based on the most recent Mortgage that was taken out on this home.
Original Mortgage
$41,600
Outstanding Balance
$36,676
Interest Rate
3.6%
Mortgage Type
Future Advance Clause Open End Mortgage
Estimated Equity
$109,979
Purchase Details
Closed on
Dec 10, 2019
Sold by
Wilma Kemple Meriam and Meriam Kemple Meriam
Bought by
Dwayne Gallogly and Dwayne Laura Gallogly
Home Financials for this Owner
Home Financials are based on the most recent Mortgage that was taken out on this home.
Original Mortgage
$41,600
Outstanding Balance
$36,676
Interest Rate
3.6%
Mortgage Type
Future Advance Clause Open End Mortgage
Estimated Equity
$109,979
Purchase Details
Closed on
Dec 27, 2010
Sold by
Estate Of Merle Foster Kemple
Bought by
Kemple Meriam Wilma
Create a Home Valuation Report for This Property
The Home Valuation Report is an in-depth analysis detailing your home's value as well as a comparison with similar homes in the area
Home Values in the Area
Average Home Value in this Area
Purchase History
| Date | Buyer | Sale Price | Title Company |
|---|---|---|---|
| Deer Run Investment Llc | -- | None Available | |
| Dwayne Gallogly | $52,000 | None Available | |
| Kemple Meriam Wilma | -- | None Available |
Source: Public Records
Mortgage History
| Date | Status | Borrower | Loan Amount |
|---|---|---|---|
| Open | Dwayne Gallogly | $41,600 |
Source: Public Records
Tax History Compared to Growth
Tax History
| Year | Tax Paid | Tax Assessment Tax Assessment Total Assessment is a certain percentage of the fair market value that is determined by local assessors to be the total taxable value of land and additions on the property. | Land | Improvement |
|---|---|---|---|---|
| 2024 | $1,622 | $37,900 | $10,190 | $27,710 |
| 2023 | $1,622 | $37,900 | $10,190 | $27,710 |
| 2022 | $1,326 | $26,440 | $7,280 | $19,160 |
| 2021 | $1,344 | $26,440 | $7,280 | $19,160 |
| 2020 | $1,288 | $26,440 | $7,280 | $19,160 |
| 2019 | $731 | $23,260 | $5,050 | $18,210 |
| 2018 | $734 | $23,260 | $5,050 | $18,210 |
| 2017 | $676 | $23,260 | $5,050 | $18,210 |
| 2016 | $677 | $21,880 | $5,050 | $16,830 |
| 2015 | $339 | $21,880 | $5,050 | $16,830 |
| 2014 | $649 | $21,880 | $5,050 | $16,830 |
Source: Public Records
Map
Nearby Homes
- 343 Sheelin Rd
- 1233 June Dr
- 1223 June Dr
- 1283 June Dr
- 1351 Omard Dr
- 1391 June Dr
- 912 Omard Dr
- 883 Omard Dr
- 1342 Kylemore Dr
- 509 Antrim Rd
- 1144 Rockwell Dr
- 121 S Progress Dr
- 305-325 Bellbrook Ave
- 613 N West St
- 1568 Cheyenne Dr
- 0 W Church St
- 137 Pleasant St
- 453 Walnut St
- 516 N King St
- 1208 Bellbrook Ave
- 212 Sheelin Rd
- 242 Sheelin Rd
- 378 Franklin Ave
- 200 Sheelin Rd
- 219 Thoreau Ln
- 205 Thoreau Ln
- 229 Sheelin Rd
- 217 Sheelin Rd
- 249 Thoreau Ln
- 193 Thoreau Ln
- 188 Sheelin Rd
- 243 Sheelin Rd
- 205 Sheelin Rd
- 270 Sheelin Rd
- 179 Thoreau Ln
- 191 Sheelin Rd
- 379 Franklin Ave
- 174 Sheelin Rd
- 1263 Frost Circle Dr
- 296 Franklin Ave