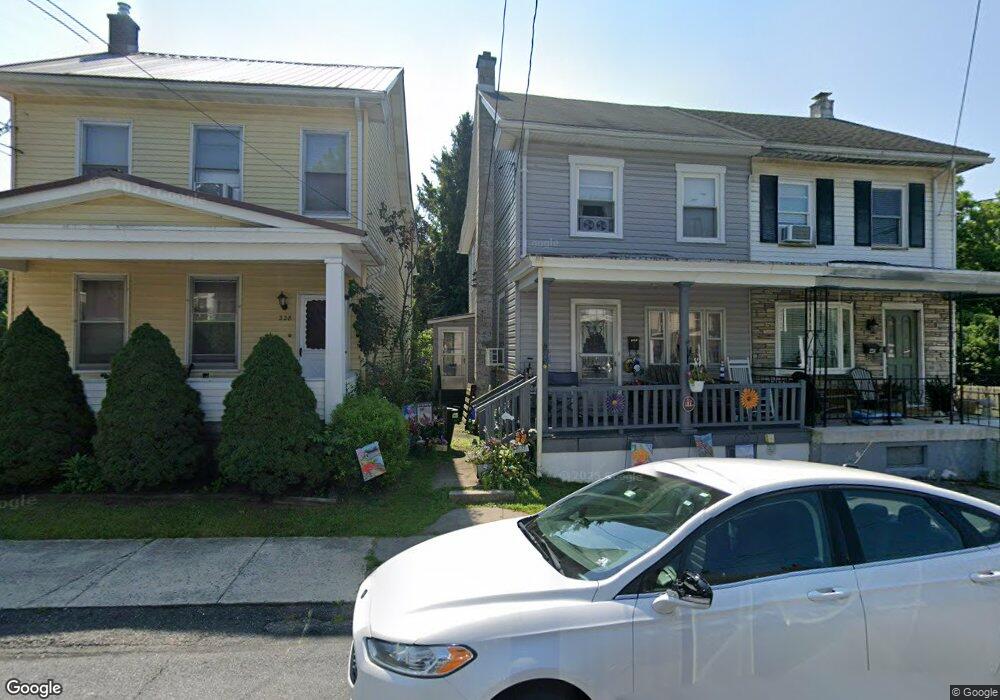
224 South St Jim Thorpe, PA 18229
Estimated Value: $138,000 - $210,000
3
Beds
1
Bath
1,368
Sq Ft
$122/Sq Ft
Est. Value
About This Home
This home is located at 224 South St, Jim Thorpe, PA 18229 and is currently estimated at $166,605, approximately $121 per square foot. 224 South St is a home located in Carbon County with nearby schools including Jim Thorpe Area High School and Sts. Peter & Paul School.
Ownership History
Date
Name
Owned For
Owner Type
Purchase Details
Closed on
Apr 21, 2017
Sold by
Busocker Agnes C
Bought by
Busocker Kyle J
Current Estimated Value
Home Financials for this Owner
Home Financials are based on the most recent Mortgage that was taken out on this home.
Original Mortgage
$32,000
Outstanding Balance
$13,971
Interest Rate
4.3%
Mortgage Type
Commercial
Estimated Equity
$152,634
Purchase Details
Closed on
Sep 12, 1978
Bought by
Busocker John J and Busocker Agnes C
Create a Home Valuation Report for This Property
The Home Valuation Report is an in-depth analysis detailing your home's value as well as a comparison with similar homes in the area
Home Values in the Area
Average Home Value in this Area
Purchase History
| Date | Buyer | Sale Price | Title Company |
|---|---|---|---|
| Busocker Kyle J | -- | None Available | |
| Busocker John J | $25,000 | -- |
Source: Public Records
Mortgage History
| Date | Status | Borrower | Loan Amount |
|---|---|---|---|
| Open | Busocker Kyle J | $32,000 |
Source: Public Records
Tax History Compared to Growth
Tax History
| Year | Tax Paid | Tax Assessment Tax Assessment Total Assessment is a certain percentage of the fair market value that is determined by local assessors to be the total taxable value of land and additions on the property. | Land | Improvement |
|---|---|---|---|---|
| 2025 | $2,326 | $29,300 | $9,250 | $20,050 |
| 2024 | $2,238 | $29,300 | $9,250 | $20,050 |
| 2023 | $2,197 | $29,300 | $9,250 | $20,050 |
| 2022 | $2,162 | $29,300 | $9,250 | $20,050 |
| 2021 | $2,162 | $29,300 | $9,250 | $20,050 |
| 2020 | $2,087 | $29,300 | $9,250 | $20,050 |
| 2019 | $2,028 | $29,300 | $9,250 | $20,050 |
| 2018 | $1,983 | $29,300 | $9,250 | $20,050 |
| 2017 | $1,924 | $29,300 | $9,250 | $20,050 |
| 2016 | -- | $29,300 | $9,250 | $20,050 |
| 2015 | -- | $29,300 | $9,250 | $20,050 |
| 2014 | -- | $29,300 | $9,250 | $20,050 |
Source: Public Records
Map
Nearby Homes