J
Seller's Agent in 2023
Jarrett Tennyson
Coldwell Banker Walden & Kirkland
(229) 344-6183
29 Total Sales
Estimated Value: $622,000 - $1,136,000
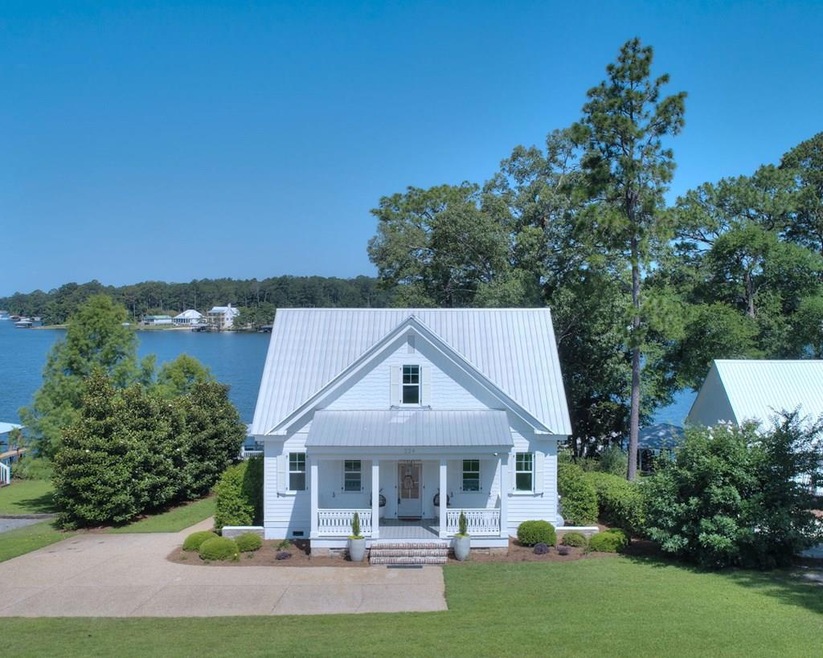
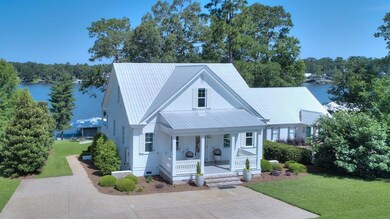
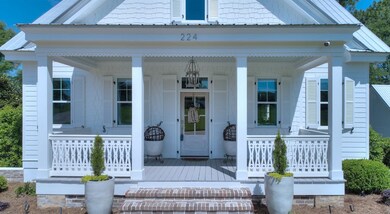
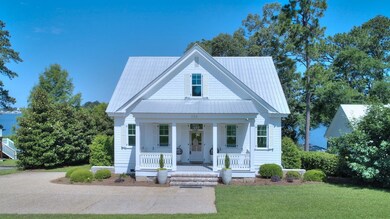
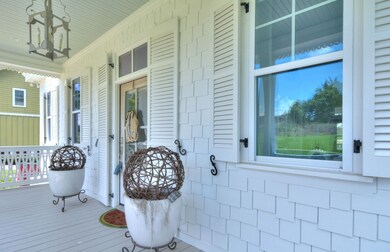
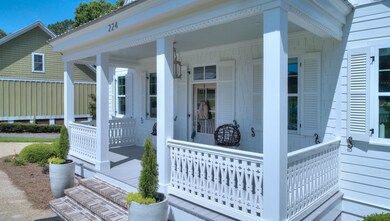
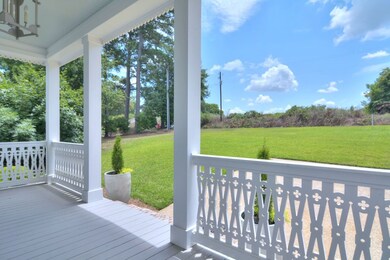
Come and see this one of a kind home at beautiful Lake Blackshear! This custom built cottage sits on a bluff with exquisite views of the lake. There is a covered back porch and a dock for outdoor gathering. There is also a fully finished basement area opening out to the back yard. Inside there is an open floor plan with shiplap walls, wood and brick floors, marble countertops, custom cabinetry, beautiful light fixtures and much more! This is a must see!!!
Last Agent to Sell the Property
Coldwell Banker Walden & Kirkland Brokerage Phone: 2294368811 License #408146 Listed on: 07/06/2023

| Date | Buyer | Sale Price | Title Company |
|---|---|---|---|
| Hom Rentals Llc | -- | -- | |
| Morris Hugh O | $205,000 | -- | |
| Clark Linda Owens | -- | -- | |
| Medders Roger A | -- | -- | |
| Medders Roger A | $268,500 | -- |
| Date | Status | Borrower | Loan Amount |
|---|---|---|---|
| Previous Owner | Morris Hugh O | $153,750 | |
| Previous Owner | Medders Roger A | $216,948 |
| Date | Event | Price | List to Sale | Price per Sq Ft |
|---|---|---|---|---|
| 08/07/2023 08/07/23 | Sold | $875,000 | -- | $353 / Sq Ft |
| 07/06/2023 07/06/23 | Pending | -- | -- | -- |
| Year | Tax Paid | Tax Assessment Tax Assessment Total Assessment is a certain percentage of the fair market value that is determined by local assessors to be the total taxable value of land and additions on the property. | Land | Improvement |
|---|---|---|---|---|
| 2025 | $7,749 | $349,522 | $79,136 | $270,386 |
| 2024 | $5,889 | $196,912 | $86,577 | $110,335 |
| 2023 | $5,889 | $196,351 | $86,016 | $110,335 |
| 2022 | $5,626 | $196,351 | $86,016 | $110,335 |
| 2021 | $5,856 | $196,351 | $86,016 | $110,335 |
| 2020 | $5,866 | $196,351 | $86,016 | $110,335 |
| 2019 | $5,866 | $196,351 | $86,016 | $110,335 |
| 2018 | $5,454 | $190,351 | $86,016 | $104,335 |
| 2017 | $5,454 | $190,351 | $86,016 | $104,335 |
| 2016 | $5,454 | $190,351 | $86,016 | $104,335 |
| 2015 | $5,463 | $169,484 | $86,016 | $83,468 |
| 2014 | $2,469 | $86,016 | $86,016 | $0 |
| 2013 | -- | $82,000 | $82,000 | $0 |
| 2012 | -- | $86,016 | $86,016 | $0 |
J
Seller's Agent in 2023
Jarrett Tennyson
Coldwell Banker Walden & Kirkland
(229) 344-6183
29 Total Sales
Buyer's Agent in 2023
Lisa Davis
The Brokerage Real Estate Company
(229) 376-8917
311 Total Sales
Source: Albany Board of REALTORS®
MLS Number: 153616
APN: LK040-022-000
Ask me questions while you tour the home.