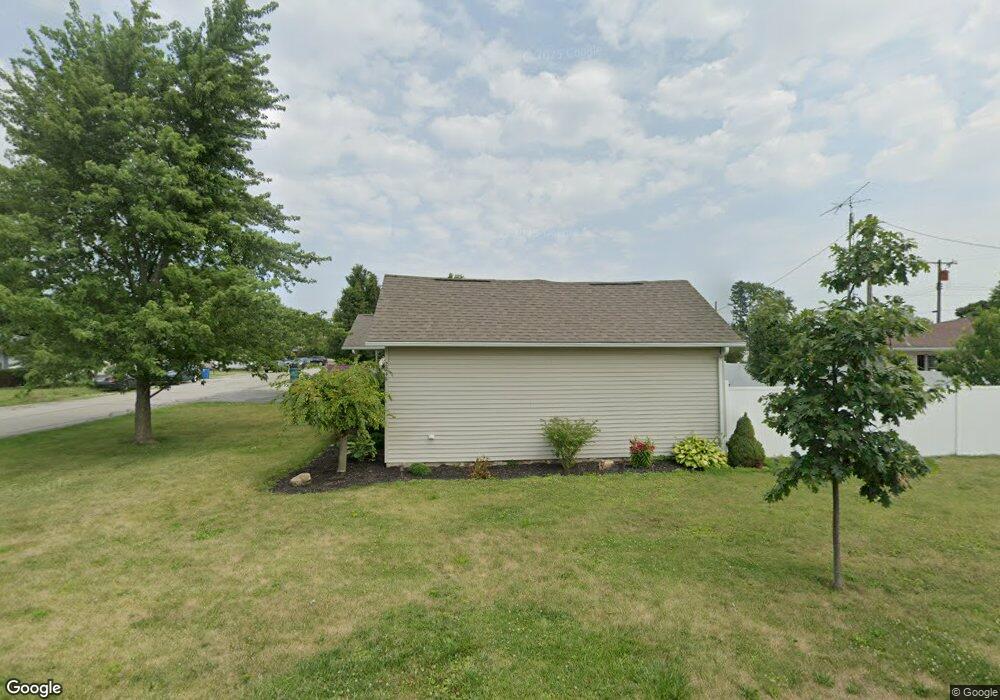
224 W Wilber St Remington, IN 47977
Carpenter NeighborhoodEstimated Value: $194,000 - $230,000
3
Beds
2
Baths
1,350
Sq Ft
$160/Sq Ft
Est. Value
About This Home
This home is located at 224 W Wilber St, Remington, IN 47977 and is currently estimated at $215,548, approximately $159 per square foot. 224 W Wilber St is a home located in Jasper County with nearby schools including Tri-County Primary School, Tri-County Intermediate School, and Tri-County Jr.-Sr. High School.
Ownership History
Date
Name
Owned For
Owner Type
Purchase Details
Closed on
Jul 30, 2010
Sold by
Fanni Mae
Bought by
Houser Mathew E and Houser Dawn M
Current Estimated Value
Home Financials for this Owner
Home Financials are based on the most recent Mortgage that was taken out on this home.
Original Mortgage
$91,191
Outstanding Balance
$60,772
Interest Rate
4.7%
Mortgage Type
New Conventional
Estimated Equity
$154,776
Purchase Details
Closed on
Mar 3, 2010
Sold by
Orville J Perry
Bought by
Fannie Mae A/K/A Federal National Mortga
Create a Home Valuation Report for This Property
The Home Valuation Report is an in-depth analysis detailing your home's value as well as a comparison with similar homes in the area
Home Values in the Area
Average Home Value in this Area
Purchase History
| Date | Buyer | Sale Price | Title Company |
|---|---|---|---|
| Houser Mathew E | -- | None Available | |
| Fannie Mae A/K/A Federal National Mortga | $97,200 | Reisenfeld & Assoc. |
Source: Public Records
Mortgage History
| Date | Status | Borrower | Loan Amount |
|---|---|---|---|
| Open | Houser Mathew E | $91,191 |
Source: Public Records
Tax History Compared to Growth
Tax History
| Year | Tax Paid | Tax Assessment Tax Assessment Total Assessment is a certain percentage of the fair market value that is determined by local assessors to be the total taxable value of land and additions on the property. | Land | Improvement |
|---|---|---|---|---|
| 2024 | $1,094 | $177,600 | $13,900 | $163,700 |
| 2023 | $811 | $160,000 | $13,900 | $146,100 |
| 2022 | $796 | $148,800 | $12,700 | $136,100 |
| 2021 | $768 | $128,000 | $12,100 | $115,900 |
| 2020 | $726 | $126,200 | $12,100 | $114,100 |
| 2019 | $746 | $128,000 | $11,500 | $116,500 |
| 2018 | $737 | $129,300 | $11,500 | $117,800 |
| 2017 | $630 | $121,400 | $11,500 | $109,900 |
| 2016 | $558 | $119,400 | $11,500 | $107,900 |
| 2014 | $514 | $116,200 | $11,500 | $104,700 |
Source: Public Records
Map
Nearby Homes