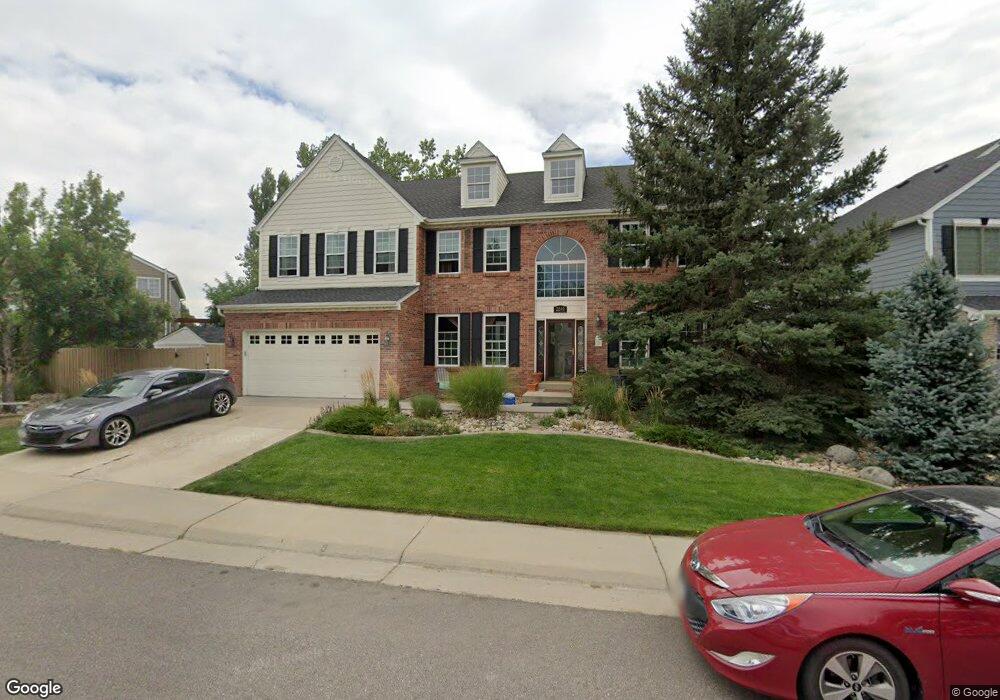
2240 Clayton Cir Superior, CO 80027
Estimated Value: $932,203 - $1,173,000
6
Beds
4
Baths
2,598
Sq Ft
$408/Sq Ft
Est. Value
About This Home
This home is located at 2240 Clayton Cir, Superior, CO 80027 and is currently estimated at $1,058,801, approximately $407 per square foot. 2240 Clayton Cir is a home located in Boulder County with nearby schools including Eldorado K-8 School, Superior Elementary School, and Monarch High School.
Ownership History
Date
Name
Owned For
Owner Type
Purchase Details
Closed on
Oct 3, 2020
Sold by
Quinn Donald P and Quinn Kimberly A
Bought by
The Donald P Quinn Living Trust
Current Estimated Value
Home Financials for this Owner
Home Financials are based on the most recent Mortgage that was taken out on this home.
Original Mortgage
$250,000
Outstanding Balance
$222,362
Interest Rate
2.9%
Mortgage Type
New Conventional
Estimated Equity
$836,439
Purchase Details
Closed on
Jul 19, 2016
Sold by
Quinn Donald P and Quinn Kimberly A
Bought by
The Donald P Quinn Living Trust and The Kimberly A Quinn Living Trust
Purchase Details
Closed on
Feb 14, 1997
Sold by
Richmond American Homes Of Colorado Inc
Bought by
Quinn Donald P
Home Financials for this Owner
Home Financials are based on the most recent Mortgage that was taken out on this home.
Original Mortgage
$170,500
Interest Rate
7.68%
Purchase Details
Closed on
Jul 28, 1993
Bought by
Quinn Donald P and Quinn Kimberly A
Create a Home Valuation Report for This Property
The Home Valuation Report is an in-depth analysis detailing your home's value as well as a comparison with similar homes in the area
Home Values in the Area
Average Home Value in this Area
Purchase History
| Date | Buyer | Sale Price | Title Company |
|---|---|---|---|
| The Donald P Quinn Living Trust | -- | None Available | |
| Quinn Donald P | -- | First American Title | |
| The Donald P Quinn Living Trust | -- | None Available | |
| Quinn Donald P | $213,205 | Land Title | |
| Quinn Donald P | -- | -- |
Source: Public Records
Mortgage History
| Date | Status | Borrower | Loan Amount |
|---|---|---|---|
| Open | Quinn Donald P | $250,000 | |
| Previous Owner | Quinn Donald P | $170,500 |
Source: Public Records
Tax History Compared to Growth
Tax History
| Year | Tax Paid | Tax Assessment Tax Assessment Total Assessment is a certain percentage of the fair market value that is determined by local assessors to be the total taxable value of land and additions on the property. | Land | Improvement |
|---|---|---|---|---|
| 2025 | $6,208 | $60,794 | $22,500 | $38,294 |
| 2024 | $6,208 | $60,794 | $22,500 | $38,294 |
| 2023 | $6,123 | $59,911 | $19,886 | $43,711 |
| 2022 | $4,791 | $45,801 | $15,728 | $30,073 |
| 2021 | $5,116 | $50,665 | $17,396 | $33,269 |
| 2020 | $4,858 | $46,239 | $17,875 | $28,364 |
| 2019 | $4,791 | $46,239 | $17,875 | $28,364 |
| 2018 | $4,441 | $42,458 | $12,384 | $30,074 |
| 2017 | $4,539 | $46,940 | $13,691 | $33,249 |
| 2016 | $4,478 | $40,469 | $12,736 | $27,733 |
| 2015 | $4,256 | $35,669 | $13,373 | $22,296 |
| 2014 | $3,787 | $35,669 | $13,373 | $22,296 |
Source: Public Records
Map
Nearby Homes
- 2225 Clayton Cir
- 882 Eldorado Dr
- 2417 Bristol St
- 2515 Andrew Dr
- 2813 Plan at 80027 - Louisville-Superior
- 2788 Plan at 80027 - Louisville-Superior
- 2376 Plan at 80027 - Louisville-Superior
- 2303 Plan at 80027 - Louisville-Superior
- 2040 Plan at 80027 - Louisville-Superior
- 2093 Plan at 80027 - Louisville-Superior
- 2106 Plan at 80027 - Louisville-Superior
- 1579 Plan at 80027 - Louisville-Superior
- 1823 Plan at 80027 - Louisville-Superior
- 1640 Plan at 80027 - Louisville-Superior
- 977 Eldorado Dr
- 888 Northern Way
- 2387 Bristol St
- 1009 Monarch Way
- 1122 Eldorado Dr
- 2204 Lasalle St
- 2260 Clayton Cir
- 2610 Clayton Cir
- 2620 Clayton Cir
- 2600 Clayton Cir
- 2280 Clayton Cir
- 2245 Clayton Cir
- 2265 Clayton Cir
- 2590 Clayton Cir
- 2205 Clayton Cir
- 2310 Clayton Cir
- 2285 Clayton Cir
- 2570 Clayton Cir
- 2320 Clayton Cir
- 2665 Clayton Cir
- 2305 Clayton Cir
- 2615 Clayton Cir
- 2605 Clayton Cir
- 2625 Clayton Cir
- 2595 Clayton Cir
- 2560 Clayton Cir