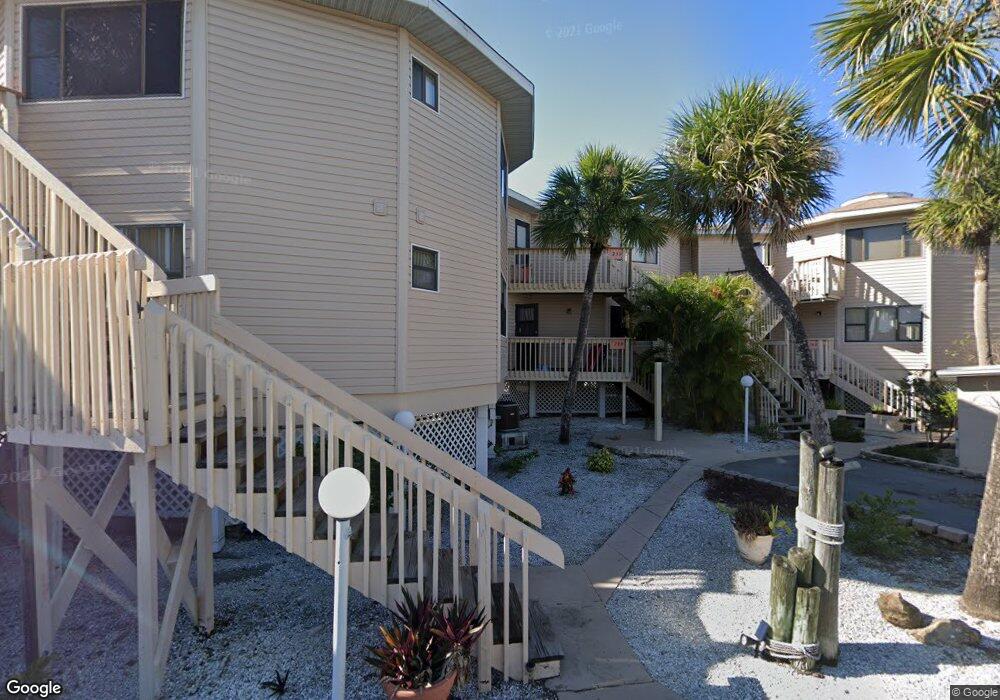
2240 N Beach Rd Unit 22A Englewood, FL 34223
Estimated Value: $258,886 - $456,000
1
Bed
1
Bath
524
Sq Ft
$681/Sq Ft
Est. Value
About This Home
This home is located at 2240 N Beach Rd Unit 22A, Englewood, FL 34223 and is currently estimated at $356,972, approximately $681 per square foot. 2240 N Beach Rd Unit 22A is a home located in Charlotte County with nearby schools including Sky Academy Englewood, Faith Christian Academy, and Englewood Christian School.
Ownership History
Date
Name
Owned For
Owner Type
Purchase Details
Closed on
Jul 1, 2005
Sold by
Easton Gary L and Easton Josphie L
Bought by
Easton Gary L
Current Estimated Value
Home Financials for this Owner
Home Financials are based on the most recent Mortgage that was taken out on this home.
Original Mortgage
$248,000
Outstanding Balance
$128,887
Interest Rate
5.69%
Mortgage Type
Fannie Mae Freddie Mac
Estimated Equity
$228,085
Purchase Details
Closed on
May 27, 2005
Sold by
Tecmire Gerald L and Tecmire Carolyn M
Bought by
Easton Gary L and Easton Josphie L
Home Financials for this Owner
Home Financials are based on the most recent Mortgage that was taken out on this home.
Original Mortgage
$248,000
Outstanding Balance
$128,887
Interest Rate
5.69%
Mortgage Type
Fannie Mae Freddie Mac
Estimated Equity
$228,085
Purchase Details
Closed on
Jan 25, 1999
Sold by
Tecmire Gerald L and Tecmire Carolyn M
Bought by
Tecmire Gerald L and Tecmire Carolyn
Create a Home Valuation Report for This Property
The Home Valuation Report is an in-depth analysis detailing your home's value as well as a comparison with similar homes in the area
Home Values in the Area
Average Home Value in this Area
Purchase History
| Date | Buyer | Sale Price | Title Company |
|---|---|---|---|
| Easton Gary L | -- | Chelsea Title Company | |
| Easton Gary L | $310,000 | Chelsea Title Company | |
| Tecmire Gerald L | -- | -- |
Source: Public Records
Mortgage History
| Date | Status | Borrower | Loan Amount |
|---|---|---|---|
| Open | Easton Gary L | $248,000 |
Source: Public Records
Tax History Compared to Growth
Tax History
| Year | Tax Paid | Tax Assessment Tax Assessment Total Assessment is a certain percentage of the fair market value that is determined by local assessors to be the total taxable value of land and additions on the property. | Land | Improvement |
|---|---|---|---|---|
| 2024 | $938 | $244,970 | -- | $244,970 |
| 2023 | $938 | $21,199 | $0 | $0 |
| 2022 | $3,865 | $204,439 | $0 | $204,439 |
| 2021 | $3,670 | $187,959 | $0 | $187,959 |
| 2020 | $3,301 | $159,273 | $0 | $159,273 |
| 2019 | $3,840 | $191,403 | $0 | $191,403 |
| 2018 | $3,395 | $177,174 | $0 | $177,174 |
| 2017 | $3,289 | $177,174 | $0 | $0 |
| 2016 | $3,182 | $150,965 | $0 | $0 |
| 2015 | $2,769 | $137,241 | $0 | $0 |
| 2014 | $2,774 | $137,233 | $0 | $0 |
Source: Public Records
Map
Nearby Homes
- 2240 N Beach Rd Unit 22D
- 218 Bayo St
- 2295 N Beach Rd Unit 419
- 2380 N Beach Rd Unit 108
- 2255 N Beach Rd Unit 3
- 2405 N Beach Rd Unit 4
- 25508 Royal Tern Ln
- 10136 Coral Shore Dr
- 2476 N Beach Rd
- 1 Pearl St
- 1977 Beach Rd Unit 72
- 1977 Beach Rd Unit 60
- 1977 Beach Rd Unit 84
- 2590 N Beach Rd Unit 5
- 2630 N Beach Rd
- 2700 N Beach Rd Unit B205
- 2700 N Beach Rd Unit A201
- 0 the Island Property Manasota Key Unit MFRC7506730
- 1820 Gulf Blvd
- 1751 Beach Rd Unit 204
- 2240 N Beach Rd Unit 24E
- 2240 N Beach Rd Unit 23E
- 2240 N Beach Rd Unit 22E
- 2240 N Beach Rd Unit 21E
- 2240 N Beach Rd Unit 20E
- 2240 N Beach Rd Unit 15E
- 2240 N Beach Rd Unit 14E
- 2240 N Beach Rd Unit 13E
- 2240 N Beach Rd Unit 12E
- 2240 N Beach Rd Unit 11E
- 2240 N Beach Rd Unit 10E
- 2240 N Beach Rd Unit 24D
- 2240 N Beach Rd Unit 14D
- 2240 N Beach Rd Unit 24C
- 2240 N Beach Rd Unit 24A
- 2240 N Beach Rd Unit 23D
- 2240 N Beach Rd Unit 23C
- 2240 N Beach Rd Unit 23A
- 2240 N Beach Rd Unit 22C
- 2240 N Beach Rd Unit 22B