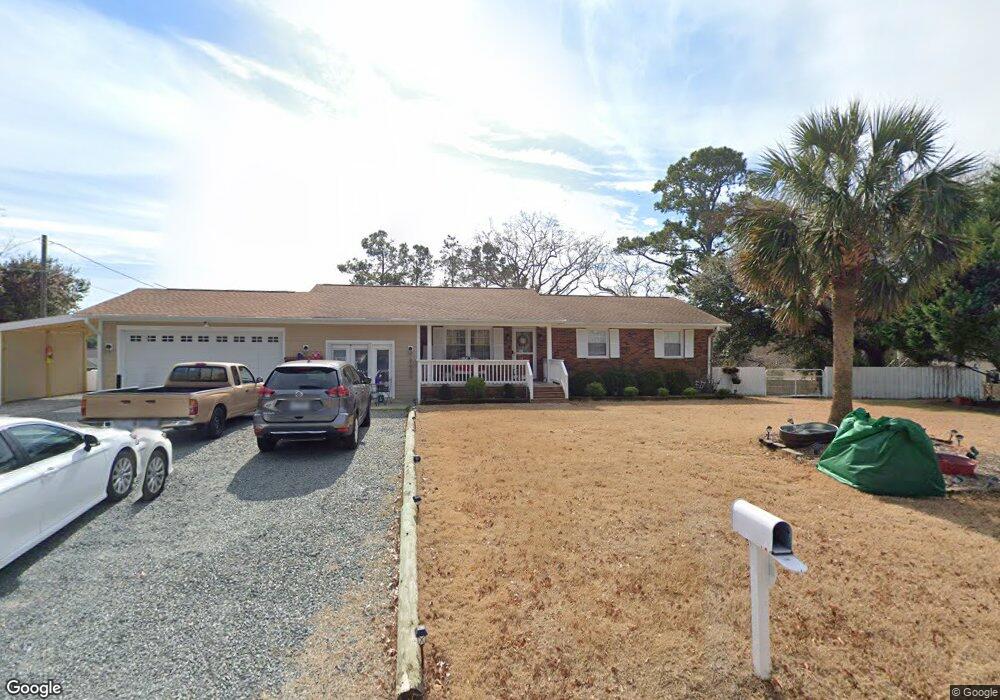
2240 Sloop Point Rd Hampstead, NC 28443
Estimated Value: $360,000 - $549,000
3
Beds
3
Baths
1,727
Sq Ft
$239/Sq Ft
Est. Value
About This Home
This home is located at 2240 Sloop Point Rd, Hampstead, NC 28443 and is currently estimated at $413,003, approximately $239 per square foot. 2240 Sloop Point Rd is a home located in Pender County with nearby schools including North Topsail Elementary School, Topsail Middle School, and Topsail High School.
Ownership History
Date
Name
Owned For
Owner Type
Purchase Details
Closed on
May 20, 2011
Sold by
Sevigny John Michael
Bought by
Sevigny John Michael and Walsh Lelah
Current Estimated Value
Purchase Details
Closed on
Dec 22, 2010
Sold by
Buckman Samuel P
Bought by
Sevigny John Michael
Home Financials for this Owner
Home Financials are based on the most recent Mortgage that was taken out on this home.
Original Mortgage
$157,874
Outstanding Balance
$102,416
Interest Rate
4.25%
Mortgage Type
FHA
Estimated Equity
$310,587
Purchase Details
Closed on
Dec 20, 2006
Sold by
Roberts Jason Allen
Bought by
Buckman Samuel P
Home Financials for this Owner
Home Financials are based on the most recent Mortgage that was taken out on this home.
Original Mortgage
$130,800
Interest Rate
8.5%
Mortgage Type
Adjustable Rate Mortgage/ARM
Create a Home Valuation Report for This Property
The Home Valuation Report is an in-depth analysis detailing your home's value as well as a comparison with similar homes in the area
Home Values in the Area
Average Home Value in this Area
Purchase History
| Date | Buyer | Sale Price | Title Company |
|---|---|---|---|
| Sevigny John Michael | -- | -- | |
| Sevigny John Michael | $160,000 | -- | |
| Buckman Samuel P | $163,500 | -- | |
| Roberts Jason Allen | -- | -- |
Source: Public Records
Mortgage History
| Date | Status | Borrower | Loan Amount |
|---|---|---|---|
| Open | Sevigny John Michael | $157,874 | |
| Previous Owner | Buckman Samuel P | $130,800 |
Source: Public Records
Tax History
| Year | Tax Paid | Tax Assessment Tax Assessment Total Assessment is a certain percentage of the fair market value that is determined by local assessors to be the total taxable value of land and additions on the property. | Land | Improvement |
|---|---|---|---|---|
| 2025 | $1,955 | $359,670 | $69,300 | $290,370 |
| 2024 | $1,955 | $189,724 | $36,603 | $153,121 |
| 2023 | $1,955 | $189,724 | $36,603 | $153,121 |
| 2022 | $1,689 | $189,724 | $36,603 | $153,121 |
| 2021 | $1,643 | $184,149 | $36,603 | $147,546 |
| 2020 | $1,643 | $184,149 | $36,603 | $147,546 |
| 2019 | $1,643 | $184,149 | $36,603 | $147,546 |
| 2018 | $1,599 | $170,636 | $50,000 | $120,636 |
| 2017 | $1,599 | $170,636 | $50,000 | $120,636 |
| 2016 | $1,582 | $170,636 | $50,000 | $120,636 |
| 2015 | $1,564 | $170,636 | $50,000 | $120,636 |
| 2014 | $1,228 | $170,636 | $50,000 | $120,636 |
| 2013 | -- | $170,636 | $50,000 | $120,636 |
| 2012 | -- | $170,636 | $50,000 | $120,636 |
Source: Public Records
Map
Nearby Homes
- 100 Cove Side Ln
- 114 Cove Side Ln
- Lot 17 Redd Banks Ln
- 114 Old Farm Rd
- 166 Camden Trail
- 38 Reston Bluff
- 113 Moores Landing Rd
- 120 Moores Landing Rd
- 53 Ballast Point Rd
- 203 Moores Landing Ct
- 400 Camden Trail
- 52 Pier View Ct
- 278 Lewis Rd
- 283 Ballast Point Rd
- 476 Andrews Rd
- 13 E Cannon Cove
- Tract B Twin Oaks Dr
- Tract A Twin Oaks Dr
- Lot 21r Shipyard Ln
- 6 Oak View Ln
- 2264 Sloop Point Rd
- 71 Zonnie Ln
- 2210 Sloop Point Rd
- 85 Zonnie Ln
- 2251 Sloop Point
- 101 Zonnie Ln
- 173 Zonnie Ln
- 16 Cove Side Ln
- 20 Cove Side Ln
- 17 Cove Side Ln
- 187 Zonnie Ln
- 52 Camden Trail
- 39 Redd Banks Ln
- 106 Cove Side Ln
- 47 Camden Trail
- 108 Cove Side Ln
- 0 Cove Side Ln
- 0 Cove Side Ln Unit 30474977
- 66 Camden Trail
- 7 Zonnie Ln
Your Personal Tour Guide
Ask me questions while you tour the home.