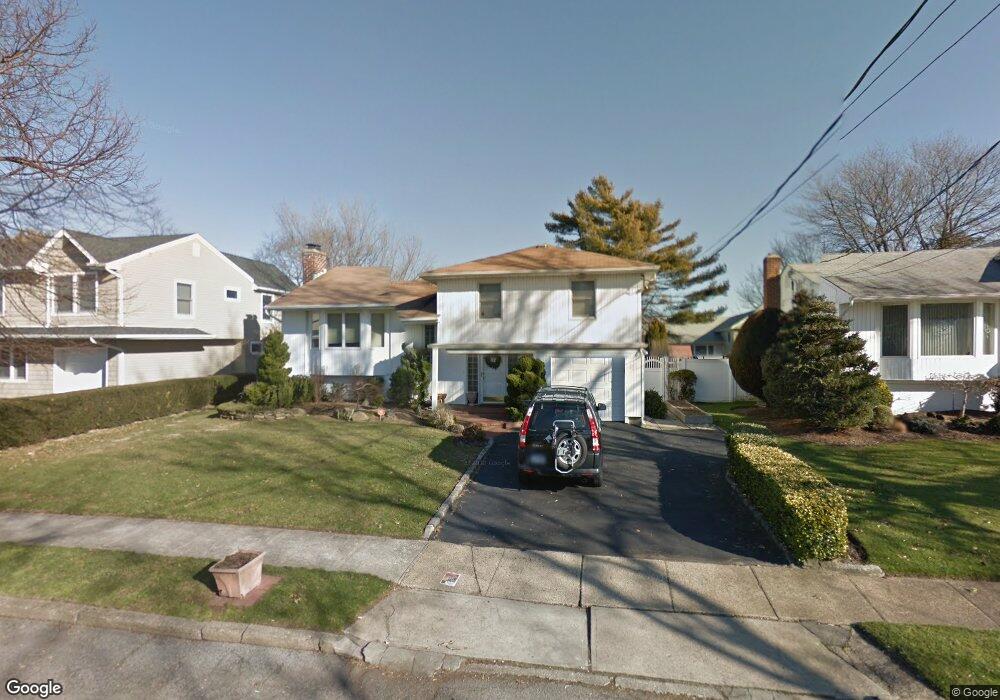
2240 Wynne Ln Bellmore, NY 11710
Estimated Value: $894,454 - $947,000
--
Bed
3
Baths
1,346
Sq Ft
$684/Sq Ft
Est. Value
About This Home
This home is located at 2240 Wynne Ln, Bellmore, NY 11710 and is currently estimated at $920,727, approximately $684 per square foot. 2240 Wynne Ln is a home located in Nassau County with nearby schools including Lt. General Thomas P. Stafford Elementary School, Shore Road School, and Winthrop Avenue School.
Ownership History
Date
Name
Owned For
Owner Type
Purchase Details
Closed on
Mar 9, 2018
Sold by
Jaikaran Jennifer and Bonn David
Bought by
Jaikaran Jennifer
Current Estimated Value
Home Financials for this Owner
Home Financials are based on the most recent Mortgage that was taken out on this home.
Original Mortgage
$356,000
Outstanding Balance
$304,629
Interest Rate
4.32%
Mortgage Type
New Conventional
Estimated Equity
$616,098
Purchase Details
Closed on
Jun 2, 2008
Sold by
Cohen Bernard
Bought by
Bonn David
Create a Home Valuation Report for This Property
The Home Valuation Report is an in-depth analysis detailing your home's value as well as a comparison with similar homes in the area
Home Values in the Area
Average Home Value in this Area
Purchase History
| Date | Buyer | Sale Price | Title Company |
|---|---|---|---|
| Jaikaran Jennifer | -- | None Available | |
| Bonn David | $575,000 | -- |
Source: Public Records
Mortgage History
| Date | Status | Borrower | Loan Amount |
|---|---|---|---|
| Open | Jaikaran Jennifer | $356,000 |
Source: Public Records
Tax History Compared to Growth
Tax History
| Year | Tax Paid | Tax Assessment Tax Assessment Total Assessment is a certain percentage of the fair market value that is determined by local assessors to be the total taxable value of land and additions on the property. | Land | Improvement |
|---|---|---|---|---|
| 2025 | $15,184 | $535 | $227 | $308 |
| 2024 | $4,427 | $606 | $257 | $349 |
| 2023 | $14,895 | $606 | $257 | $349 |
| 2022 | $14,895 | $606 | $257 | $349 |
| 2021 | $19,510 | $580 | $246 | $334 |
| 2020 | $12,863 | $689 | $688 | $1 |
| 2019 | $3,505 | $738 | $737 | $1 |
| 2018 | $3,593 | $787 | $0 | $0 |
| 2017 | $8,779 | $931 | $633 | $298 |
| 2016 | $12,856 | $931 | $633 | $298 |
| 2015 | $4,919 | $1,206 | $820 | $386 |
| 2014 | $4,919 | $1,206 | $820 | $386 |
| 2013 | $4,618 | $1,206 | $820 | $386 |
Source: Public Records
Map
Nearby Homes