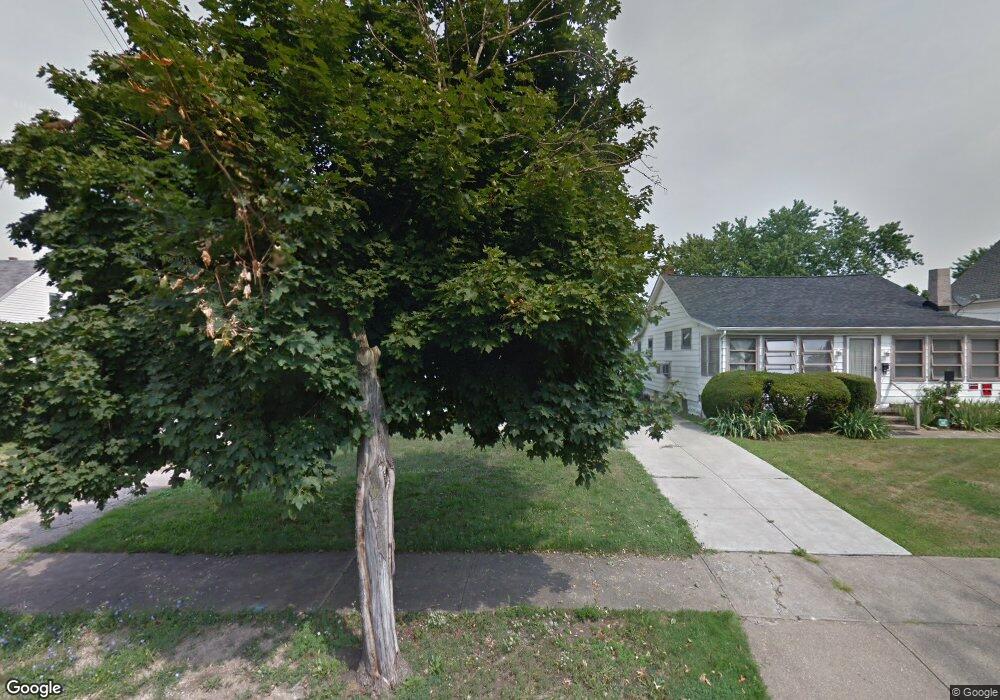
22401 Coulter Ave Euclid, OH 44117
Estimated Value: $102,000 - $192,000
3
Beds
2
Baths
980
Sq Ft
$131/Sq Ft
Est. Value
About This Home
This home is located at 22401 Coulter Ave, Euclid, OH 44117 and is currently estimated at $128,514, approximately $131 per square foot. 22401 Coulter Ave is a home located in Cuyahoga County with nearby schools including Bluestone Elementary School, Euclid Middle School, and Euclid High School.
Ownership History
Date
Name
Owned For
Owner Type
Purchase Details
Closed on
Jan 31, 2013
Sold by
Metta Investments Llc
Bought by
Equity Trust Company and Sumant Munjal Ira
Current Estimated Value
Purchase Details
Closed on
Nov 30, 2012
Sold by
Specialized Property Investments Llc
Bought by
Metta Investments Llc
Purchase Details
Closed on
May 8, 2012
Sold by
5209 Investments Incorporated
Bought by
Specialized Property Investments Llc
Purchase Details
Closed on
Apr 17, 2012
Sold by
Cash Flow Kings Llc
Bought by
5209 Investments Incoporated
Purchase Details
Closed on
Mar 9, 2012
Sold by
Ransom Emma Lee
Bought by
Cash Flow Kings Llc
Purchase Details
Closed on
Apr 9, 1993
Sold by
Swiney Billy R and Swiney Lila L
Bought by
Ransom Emma Lee
Purchase Details
Closed on
Jan 1, 1975
Bought by
Swiney Billy R and Swiney Lila L
Create a Home Valuation Report for This Property
The Home Valuation Report is an in-depth analysis detailing your home's value as well as a comparison with similar homes in the area
Home Values in the Area
Average Home Value in this Area
Purchase History
| Date | Buyer | Sale Price | Title Company |
|---|---|---|---|
| Equity Trust Company | $70,942 | None Available | |
| Metta Investments Llc | $58,942 | T Title Agency | |
| Specialized Property Investments Llc | $58,942 | Mount Morris Title Agency | |
| 5209 Investments Incoporated | $35,500 | Mount Morris Title Agency | |
| Cash Flow Kings Llc | $19,000 | Enterprise Title Agency | |
| Ransom Emma Lee | $40,000 | -- | |
| Swiney Billy R | -- | -- |
Source: Public Records
Tax History Compared to Growth
Tax History
| Year | Tax Paid | Tax Assessment Tax Assessment Total Assessment is a certain percentage of the fair market value that is determined by local assessors to be the total taxable value of land and additions on the property. | Land | Improvement |
|---|---|---|---|---|
| 2024 | $1,799 | $24,780 | $6,160 | $18,620 |
| 2023 | $1,679 | $18,380 | $4,800 | $13,580 |
| 2022 | $1,643 | $18,375 | $4,795 | $13,580 |
| 2021 | $1,822 | $18,380 | $4,800 | $13,580 |
| 2020 | $1,692 | $13,930 | $3,640 | $10,290 |
| 2019 | $1,534 | $39,800 | $10,400 | $29,400 |
| 2018 | $1,395 | $13,930 | $3,640 | $10,290 |
| 2017 | $1,592 | $11,940 | $2,980 | $8,960 |
| 2016 | $1,436 | $11,940 | $2,980 | $8,960 |
| 2015 | $1,627 | $11,940 | $2,980 | $8,960 |
| 2014 | $1,627 | $14,040 | $3,500 | $10,540 |
Source: Public Records
Map
Nearby Homes
- 1554 E 221st St
- 21950 Euclid Ave
- 1545 E 214th St
- 1775 E 228th St
- 23795 Greenwood Rd
- 1685 Oakham Rd
- 22790 Fairlawn Dr
- 2010 E 221st St
- 1765 E 238th St
- 1620 E 243rd St
- 24105 Chardon Rd
- 2075 E 226th St
- 950 E 216th St
- 901 E 210th St
- 2093 Newcome St
- 918 E 216th St
- 1524 E 204th St
- 21070 N Vine Ave
- 24691 Hawthorne Dr
- 24690 Hawthorne Dr
- 22409 Coulter Ave
- 22357 Coulter Ave
- 22439 Coulter Ave
- 22351 Coulter Ave
- 22471 Coulter Ave
- 22331 Coulter Ave
- 22491 Coulter Ave
- 1425 E 222nd St
- 22531 Coulter Ave
- 1421 E 222nd St
- 22400 Coulter Ave
- 22370 Coulter Ave
- 22420 Coulter Ave
- 22450 Coulter Ave
- 22350 Coulter Ave
- 22470 Coulter Ave
- 22500 Coulter Ave
- 1445 E 222nd St
- 22551 Coulter Ave
- 22530 Coulter Ave