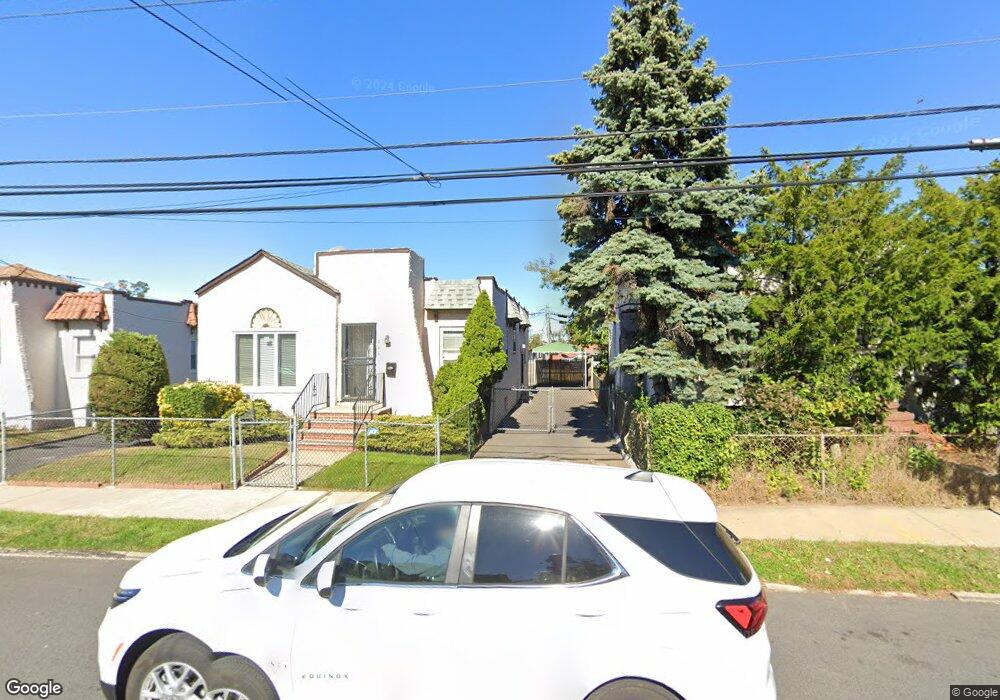
22407 133rd Ave Laurelton, NY 11413
Laurelton NeighborhoodEstimated Value: $600,000 - $681,000
--
Bed
1
Bath
1,100
Sq Ft
$579/Sq Ft
Est. Value
About This Home
This home is located at 22407 133rd Ave, Laurelton, NY 11413 and is currently estimated at $637,121, approximately $579 per square foot. 22407 133rd Ave is a home located in Queens County with nearby schools including P.S. 132 - Ralph Bunche, Is 59 Springfield Gardens, and Success Academy Springfield Gardens.
Ownership History
Date
Name
Owned For
Owner Type
Purchase Details
Closed on
Jan 11, 2023
Sold by
Nesmith Terralynn Faye
Bought by
Murray Mo'Nique
Current Estimated Value
Home Financials for this Owner
Home Financials are based on the most recent Mortgage that was taken out on this home.
Original Mortgage
$503,984
Outstanding Balance
$489,271
Interest Rate
6.33%
Mortgage Type
Purchase Money Mortgage
Estimated Equity
$142,222
Purchase Details
Closed on
Aug 3, 2022
Sold by
Nesmith Terralynn Faye
Bought by
Nesmith Terralynn Faye
Purchase Details
Closed on
Jan 25, 2001
Sold by
Baglietto Jack
Bought by
Nesmith Colus
Home Financials for this Owner
Home Financials are based on the most recent Mortgage that was taken out on this home.
Original Mortgage
$175,800
Interest Rate
7.08%
Mortgage Type
VA
Create a Home Valuation Report for This Property
The Home Valuation Report is an in-depth analysis detailing your home's value as well as a comparison with similar homes in the area
Home Values in the Area
Average Home Value in this Area
Purchase History
| Date | Buyer | Sale Price | Title Company |
|---|---|---|---|
| Murray Mo'Nique | $537,000 | -- | |
| Nesmith Terralynn Faye | -- | -- | |
| Nesmith Colus | $172,500 | First American Title Ins Co |
Source: Public Records
Mortgage History
| Date | Status | Borrower | Loan Amount |
|---|---|---|---|
| Open | Murray Mo'Nique | $70,000 | |
| Open | Murray Mo'Nique | $503,984 | |
| Previous Owner | Nesmith Colus | $208,850 | |
| Previous Owner | Nesmith Colus J | $49,500 | |
| Previous Owner | Nesmith Colus | $175,800 |
Source: Public Records
Tax History Compared to Growth
Tax History
| Year | Tax Paid | Tax Assessment Tax Assessment Total Assessment is a certain percentage of the fair market value that is determined by local assessors to be the total taxable value of land and additions on the property. | Land | Improvement |
|---|---|---|---|---|
| 2025 | $5,872 | $30,059 | $8,179 | $21,880 |
| 2024 | $5,872 | $29,237 | $8,024 | $21,213 |
| 2023 | $5,597 | $27,868 | $7,701 | $20,167 |
| 2022 | $4,701 | $31,920 | $9,600 | $22,320 |
| 2021 | $4,685 | $30,900 | $9,600 | $21,300 |
| 2020 | $4,397 | $29,460 | $9,600 | $19,860 |
| 2019 | $4,201 | $27,960 | $9,600 | $18,360 |
| 2018 | $3,849 | $23,223 | $9,431 | $13,792 |
| 2017 | $4,137 | $23,220 | $9,600 | $13,620 |
| 2016 | $3,832 | $23,220 | $9,600 | $13,620 |
| 2015 | $2,279 | $20,874 | $9,527 | $11,347 |
| 2014 | $2,279 | $20,304 | $10,537 | $9,767 |
Source: Public Records
Map
Nearby Homes
- 131-58 225th St
- 131-62 224th St
- 225-01 135th Ave
- 131-45 227th St
- 133-15 220th St
- 220-24 134th Rd
- 131-33 228th St
- 130-60 223rd St
- 135-28 226th St
- 22109 131st Ave
- 13069 227th St
- 130-43 224th St
- 13055 222nd St
- 135-06 228th St
- 22019 135th Ave
- 22111 136th Ave
- 133-28 230th St
- 134-21 229th St
- 218-36 133rd Rd
- 134-24 230th St