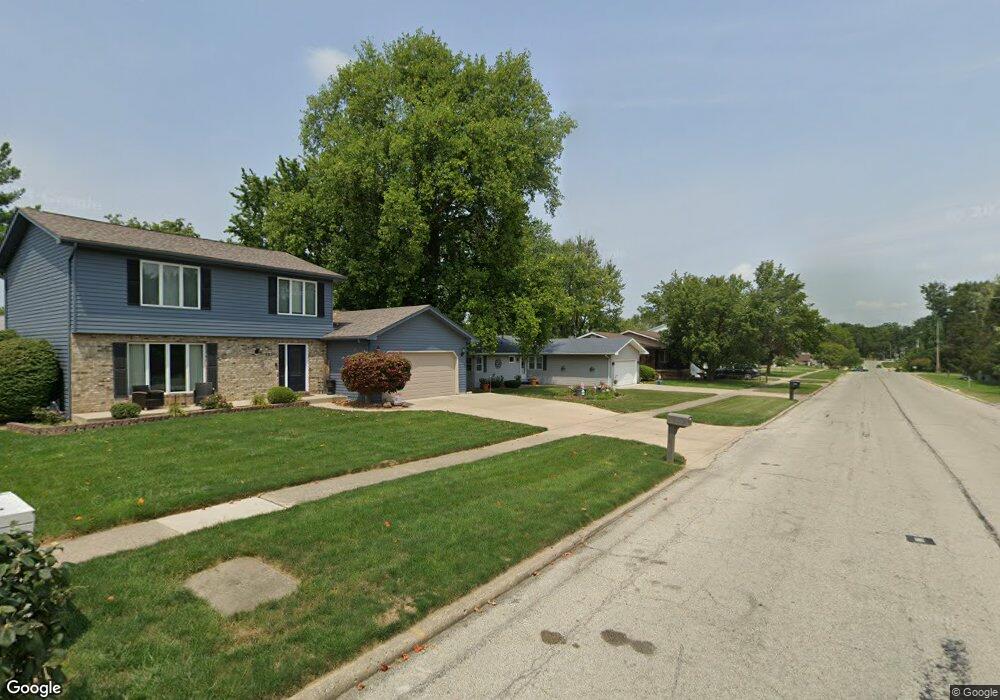
2241 N Summit Ave Decatur, IL 62526
Home Park NeighborhoodEstimated Value: $137,753 - $151,000
3
Beds
1
Bath
1,352
Sq Ft
$108/Sq Ft
Est. Value
About This Home
This home is located at 2241 N Summit Ave, Decatur, IL 62526 and is currently estimated at $145,688, approximately $107 per square foot. 2241 N Summit Ave is a home located in Macon County with nearby schools including Stephen Decatur Middle School and Northwest Christian Campus.
Ownership History
Date
Name
Owned For
Owner Type
Purchase Details
Closed on
May 6, 2013
Sold by
National Residential Nominee Services In
Bought by
Morlock Michael E and Morlock Debra S
Current Estimated Value
Purchase Details
Closed on
Feb 8, 2013
Sold by
Lohman Jill M
Bought by
National Residential Nominee Services In
Purchase Details
Closed on
Apr 3, 2009
Sold by
Wilkinson Todd R and Wilkinson Melody T
Bought by
Lohman Jill M
Home Financials for this Owner
Home Financials are based on the most recent Mortgage that was taken out on this home.
Original Mortgage
$82,926
Interest Rate
5.11%
Mortgage Type
FHA
Purchase Details
Closed on
Jun 24, 2005
Sold by
Carter E Loraine and Rowland Marvin L
Bought by
Wilkinson Todd R and Wilkinson Melody T
Home Financials for this Owner
Home Financials are based on the most recent Mortgage that was taken out on this home.
Original Mortgage
$5,000
Interest Rate
5.86%
Mortgage Type
Unknown
Purchase Details
Closed on
Jul 1, 1998
Create a Home Valuation Report for This Property
The Home Valuation Report is an in-depth analysis detailing your home's value as well as a comparison with similar homes in the area
Home Values in the Area
Average Home Value in this Area
Purchase History
| Date | Buyer | Sale Price | Title Company |
|---|---|---|---|
| Morlock Michael E | $85,000 | None Available | |
| National Residential Nominee Services In | $85,000 | None Available | |
| Lohman Jill M | $84,500 | None Available | |
| Wilkinson Todd R | $80,000 | None Available | |
| -- | $75,000 | -- |
Source: Public Records
Mortgage History
| Date | Status | Borrower | Loan Amount |
|---|---|---|---|
| Previous Owner | Lohman Jill M | $82,926 | |
| Previous Owner | Wilkinson Todd R | $5,000 | |
| Previous Owner | Wilkinson Todd R | $61,195 |
Source: Public Records
Tax History Compared to Growth
Tax History
| Year | Tax Paid | Tax Assessment Tax Assessment Total Assessment is a certain percentage of the fair market value that is determined by local assessors to be the total taxable value of land and additions on the property. | Land | Improvement |
|---|---|---|---|---|
| 2024 | $2,682 | $38,705 | $6,530 | $32,175 |
| 2023 | $2,621 | $37,335 | $6,299 | $31,036 |
| 2022 | $1,731 | $27,921 | $5,829 | $22,092 |
| 2021 | $1,551 | $26,074 | $5,443 | $20,631 |
| 2020 | $2,006 | $24,863 | $5,190 | $19,673 |
| 2019 | $2,006 | $24,863 | $5,190 | $19,673 |
| 2018 | $1,936 | $24,423 | $5,260 | $19,163 |
| 2017 | $1,998 | $25,075 | $5,400 | $19,675 |
| 2016 | $2,043 | $25,331 | $5,455 | $19,876 |
| 2015 | $1,930 | $24,884 | $5,359 | $19,525 |
| 2014 | $1,787 | $24,638 | $5,306 | $19,332 |
| 2013 | $2,440 | $25,563 | $5,505 | $20,058 |
Source: Public Records
Map
Nearby Homes
- 2281 N Summit Ave
- 1929 W Ravina Park Rd
- 2131 N Oakcrest Ct
- 2404 N Longwood Dr
- 1720 W Ravina Park Rd
- 2320 N Kenwood Ct
- 1607 W Melrose Ct
- 2121 Barding Ave
- 2125 Clearmont Ave
- 1625 W Garfield Ave
- 2262 Yorkshire Dr
- 2306 Yorkshire Dr
- 1650 N Dennis Ave
- 2273 N Fairview Ave
- 2406 W Olive St
- 1706 W Division St
- 2848 N Primrose Ln
- 1524 N Summit Ave
- 2195 W Center St
- 1530 W Cushing St
- 2261 N Summit Ave
- 2221 N Summit Ave
- 2250 N Summit Ave
- 2260 N Longwood Dr
- 2201 N Summit Ave
- 2302 N Longwood Dr
- 2240 N Longwood Dr
- 2303 N Summit Ave
- 1924 W Ravina Park Rd
- 1936 W Ravina Park Rd
- 2310 N Longwood Dr
- 1890 W Ravina Park Rd
- 2220 N Longwood Dr
- 1880 W Ravina Park Rd
- 2318 N Longwood Dr
- 2025 W Woodbine Dr
- 1885 W Ravina Park Rd
- 2241 N Longwood Dr
- 2343 N Summit Ave
- 2326 N Longwood Dr