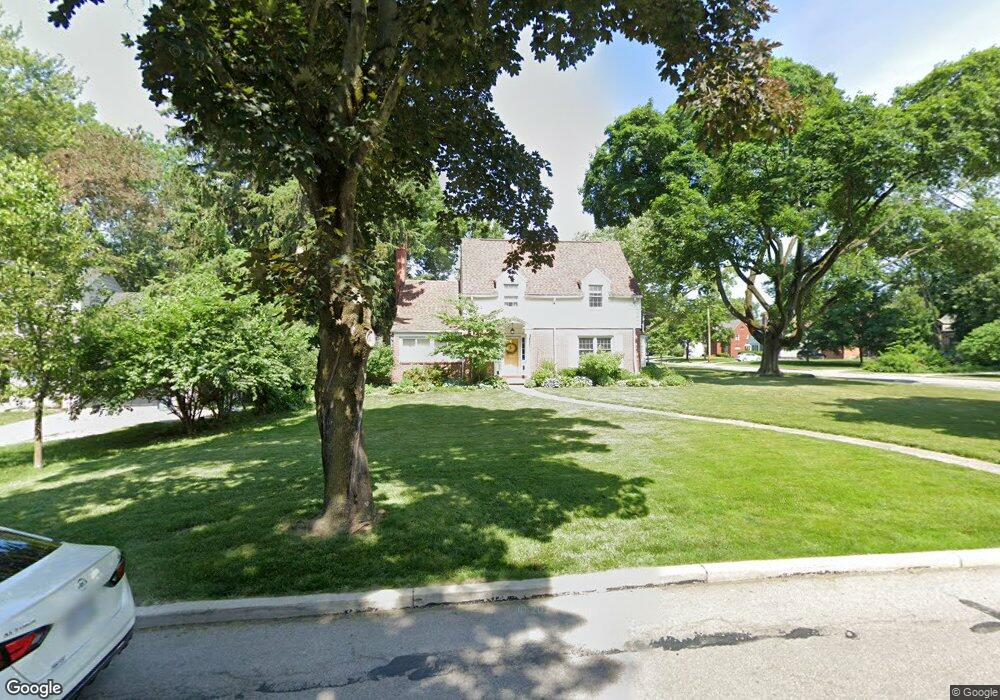
2241 Orchard Rd Ottawa Hills, OH 43606
Estimated Value: $363,637 - $445,000
3
Beds
2
Baths
2,361
Sq Ft
$166/Sq Ft
Est. Value
About This Home
This home is located at 2241 Orchard Rd, Ottawa Hills, OH 43606 and is currently estimated at $391,409, approximately $165 per square foot. 2241 Orchard Rd is a home located in Lucas County with nearby schools including Ottawa Hills Elementary School, Ottawa Hills High School, and Central Academy Of Ohio.
Ownership History
Date
Name
Owned For
Owner Type
Purchase Details
Closed on
Aug 6, 2021
Sold by
Clark Sara F and Clark Richard A
Bought by
Clark Sara F
Current Estimated Value
Purchase Details
Closed on
Sep 22, 2017
Sold by
Burkhart Craig G and Burkhart Anna
Bought by
Clark Sara F and Clark Richard A
Home Financials for this Owner
Home Financials are based on the most recent Mortgage that was taken out on this home.
Original Mortgage
$198,500
Outstanding Balance
$165,762
Interest Rate
3.9%
Mortgage Type
New Conventional
Estimated Equity
$225,647
Purchase Details
Closed on
May 5, 2017
Sold by
Julia Sakaari T and Julia Shirley A
Bought by
Burkhart Craig G and Burkhart Kristina
Home Financials for this Owner
Home Financials are based on the most recent Mortgage that was taken out on this home.
Original Mortgage
$90,000
Interest Rate
4.14%
Mortgage Type
Future Advance Clause Open End Mortgage
Purchase Details
Closed on
Mar 19, 1991
Sold by
Burkhart Burkhart C C and Burkhart K
Create a Home Valuation Report for This Property
The Home Valuation Report is an in-depth analysis detailing your home's value as well as a comparison with similar homes in the area
Home Values in the Area
Average Home Value in this Area
Purchase History
| Date | Buyer | Sale Price | Title Company |
|---|---|---|---|
| Clark Sara F | -- | None Available | |
| Clark Sara F | $209,000 | None Available | |
| Burkhart Craig G | $96,000 | None Available | |
| -- | $109,000 | -- |
Source: Public Records
Mortgage History
| Date | Status | Borrower | Loan Amount |
|---|---|---|---|
| Open | Clark Sara F | $198,500 | |
| Closed | Burkhart Craig G | $90,000 |
Source: Public Records
Tax History Compared to Growth
Tax History
| Year | Tax Paid | Tax Assessment Tax Assessment Total Assessment is a certain percentage of the fair market value that is determined by local assessors to be the total taxable value of land and additions on the property. | Land | Improvement |
|---|---|---|---|---|
| 2024 | $4,572 | $103,880 | $18,970 | $84,910 |
| 2023 | $8,624 | $89,530 | $15,960 | $73,570 |
| 2022 | $8,709 | $89,530 | $15,960 | $73,570 |
| 2021 | $8,824 | $89,530 | $15,960 | $73,570 |
| 2020 | $8,283 | $75,285 | $13,440 | $61,845 |
| 2019 | $7,507 | $75,285 | $13,440 | $61,845 |
| 2018 | $6,824 | $75,285 | $13,440 | $61,845 |
| 2017 | $10,494 | $66,710 | $14,805 | $51,905 |
| 2016 | $6,142 | $190,600 | $42,300 | $148,300 |
| 2015 | $6,165 | $190,600 | $42,300 | $148,300 |
| 2014 | $5,943 | $66,720 | $14,810 | $51,910 |
| 2013 | $5,943 | $66,720 | $14,810 | $51,910 |
Source: Public Records
Map
Nearby Homes
- 2324 Secor Rd
- 3329 Darlington Rd
- 3614 Edgevale Rd
- 3155 Kylemore Rd
- 3704 Brookside Rd
- 2013 Bretton Place
- 2009 Bretton Place
- 2550 Secor Rd
- 3225 Kenwood Blvd
- 3765 Brookside Rd
- 2713 E Rockridge Cir
- 2823 Wicklow Rd
- 3408 Christie Blvd
- 2310 Goddard Rd
- 2810 Evergreen Rd
- 2824 Secor Rd
- 2541 Goddard Rd
- 4028 Brookside Rd
- 4057 Hillandale Rd Unit 4
- 2918 Evergreen Rd
- 3404 Chestnut Hill Rd
- 3421 Indian Rd
- 3422 Chestnut Hill Rd
- 3427 Indian Rd
- 2236 Orchard Rd
- 2228 Orchard Rd
- 2275 Orchard Rd
- 3410 Indian Rd
- 3433 Indian Rd
- 3416 Indian Rd
- 2220 Orchard Rd
- 3432 Chestnut Hill Rd
- 3423 Chestnut Hill Rd
- 2274 Orchard Rd
- 3439 Indian Rd
- 3428 Indian Rd
- 2212 Orchard Rd
- 3366 Indian Rd
- 3431 Chestnut Hill Rd
- 3434 Indian Rd