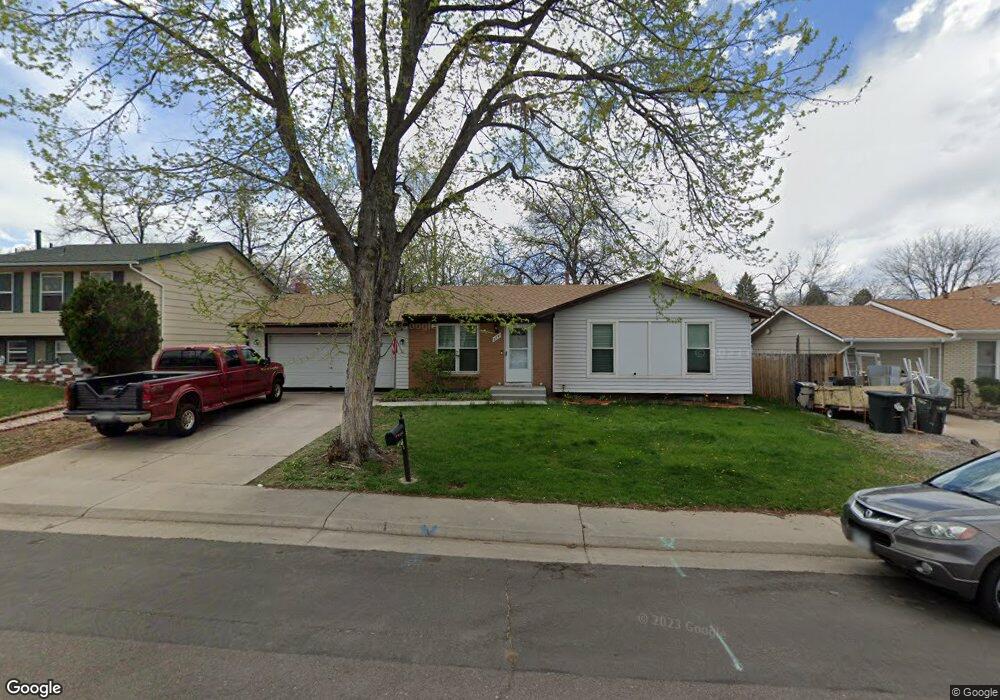
2241 S Memphis St Aurora, CO 80013
Horseshoe Park NeighborhoodEstimated Value: $426,000 - $468,000
3
Beds
1
Bath
980
Sq Ft
$450/Sq Ft
Est. Value
About This Home
This home is located at 2241 S Memphis St, Aurora, CO 80013 and is currently estimated at $441,477, approximately $450 per square foot. 2241 S Memphis St is a home located in Arapahoe County with nearby schools including Yale Elementary School, Columbia Middle School, and Rangeview High School.
Ownership History
Date
Name
Owned For
Owner Type
Purchase Details
Closed on
Oct 30, 2008
Sold by
Secretary Of Housing & Urban Development
Bought by
Hurlbut Andrew M and Hurlbut Darla L
Current Estimated Value
Home Financials for this Owner
Home Financials are based on the most recent Mortgage that was taken out on this home.
Original Mortgage
$130,139
Outstanding Balance
$84,364
Interest Rate
5.83%
Mortgage Type
FHA
Estimated Equity
$357,113
Purchase Details
Closed on
Jul 7, 2008
Sold by
Kneen Lawrence K
Bought by
Hud
Purchase Details
Closed on
Mar 15, 2000
Sold by
Walker James H
Bought by
Kneen Lawrence K
Home Financials for this Owner
Home Financials are based on the most recent Mortgage that was taken out on this home.
Original Mortgage
$144,019
Interest Rate
8.23%
Mortgage Type
FHA
Purchase Details
Closed on
Jul 4, 1776
Bought by
Conversion Arapco
Create a Home Valuation Report for This Property
The Home Valuation Report is an in-depth analysis detailing your home's value as well as a comparison with similar homes in the area
Home Values in the Area
Average Home Value in this Area
Purchase History
| Date | Buyer | Sale Price | Title Company |
|---|---|---|---|
| Hurlbut Andrew M | $125,000 | Wtg | |
| Hud | -- | None Available | |
| Kneen Lawrence K | $145,000 | Land Title | |
| Conversion Arapco | -- | -- |
Source: Public Records
Mortgage History
| Date | Status | Borrower | Loan Amount |
|---|---|---|---|
| Open | Hurlbut Andrew M | $130,139 | |
| Previous Owner | Kneen Lawrence K | $144,019 |
Source: Public Records
Tax History Compared to Growth
Tax History
| Year | Tax Paid | Tax Assessment Tax Assessment Total Assessment is a certain percentage of the fair market value that is determined by local assessors to be the total taxable value of land and additions on the property. | Land | Improvement |
|---|---|---|---|---|
| 2024 | $2,722 | $29,286 | -- | -- |
| 2023 | $2,460 | $29,286 | $0 | $0 |
| 2022 | $2,460 | $24,499 | $0 | $0 |
| 2021 | $2,539 | $24,499 | $0 | $0 |
| 2020 | $2,263 | $21,737 | $0 | $0 |
| 2019 | $2,251 | $21,737 | $0 | $0 |
| 2018 | $2,101 | $19,872 | $0 | $0 |
| 2017 | $1,828 | $19,872 | $0 | $0 |
| 2016 | $1,403 | $14,933 | $0 | $0 |
| 2015 | $1,354 | $14,933 | $0 | $0 |
| 2014 | $1,077 | $11,439 | $0 | $0 |
| 2013 | -- | $10,170 | $0 | $0 |
Source: Public Records
Map
Nearby Homes
- 16026 E Warren Place
- 2145 S Lewiston St
- 2463 S Memphis Way
- 2497 S Mobile St
- 2215 S Buckley Rd Unit 201
- 16497 E Vassar Ave
- 2150 S Idalia St
- 2493 S Kalispell Cir
- 15532 E Pacific Place
- 16622 E Asbury Ave
- 15671 E Atlantic Cir
- 2139 S Ouray St
- 15512 E Pacific Place
- 2615 S Laredo Ct
- 2082 S Helena St Unit A
- 1996 S Olathe St
- 16836 E Asbury Ave
- 16845 E Asbury Ave
- 15880 E Utah Place
- 17033 E Pacific Place
- 2231 S Memphis St
- 2251 S Memphis St
- 2230 S Lewiston St
- 2240 S Lewiston St
- 2221 S Memphis St
- 2250 S Lewiston St
- 2261 S Memphis St Unit 1
- 2220 S Lewiston St
- 2232 S Memphis St
- 2242 S Memphis St
- 2252 S Memphis St
- 2222 S Memphis St
- 2271 S Memphis St Unit 1
- 2262 S Memphis St
- 2204 S Mobile Way
- 2270 S Lewiston St
- 2249 S Lewiston St
- 2239 S Lewiston St
- 2267 S Norfolk St
- 2265 S Norfolk St