
Seller's Agent in 2026
Ashlee Jack
(580) 318-0834
459 Total Sales
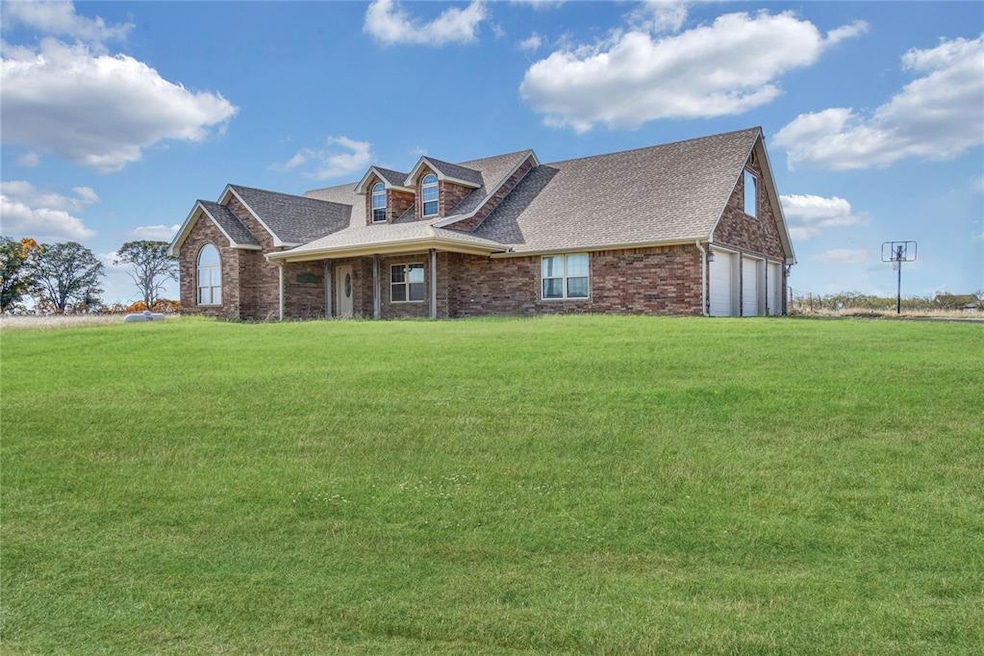

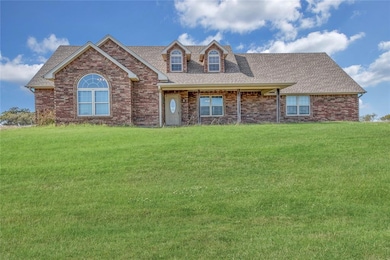
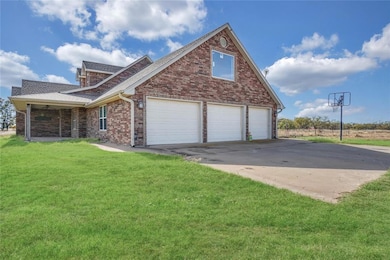
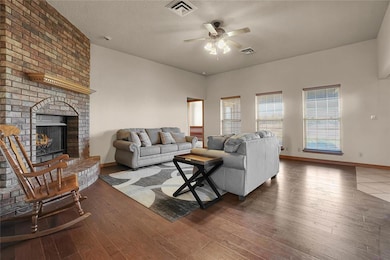
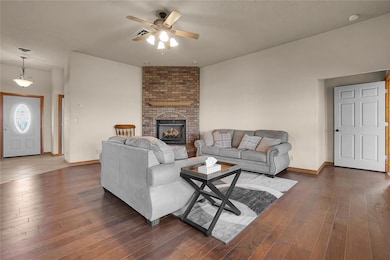
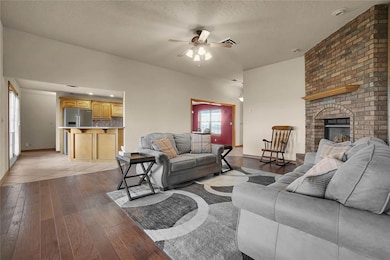
Location, Location, Location! This property has it all on 10 acres(+/-). Feel right at home the moment you turn onto the long, winding driveway. The house sits perfectly on the property, offering stunning panoramic view’s for miles. Pull up to the oversize three-car garage and inviting covered front porch. Step inside to a warm, welcoming entryway that opens into a bright open-concept living area centered around a stunning stone fireplace. The living space flows seamlessly into the kitchen, featuring a large island with sink and seating, stainless steel appliances (refrigerator, built-in stove, and microwave), and beautiful light wood cabinetry with ample storage. The formal dining area is connected and a great place for gatherings!
The primary suite is privately tucked away from the guest rooms and features a spacious bedroom with soft carpet, direct access to the patio, and a luxurious ensuite bathroom. Enjoy a soaking tub, walk-in shower with glass doors, double vanities, and walk-in closet access.
Two generous guest bedrooms and a full guest bath with a tub/shower combo are located on the main floor. Upstairs, you’ll find a versatile fourth bedroom or bonus room, perfect as a second living area, office, or guest suite, with scenic window views and easy access to multiple attic storage spaces. Upstairs also features a half bath access.
Outside, relax under the covered back patio and take in the peaceful surroundings. This property truly has it all. Space, views, and that welcoming country feel. A must-see!
| Date | Type | Sale Price | Title Company |
|---|---|---|---|
| Personal Reps Deed | $360,000 | Sovereign Title | |
| Quit Claim Deed | -- | None Listed On Document | |
| Warranty Deed | $263,000 | -- | |
| Warranty Deed | $234,500 | -- | |
| Warranty Deed | $200,000 | -- | |
| Warranty Deed | $21,000 | -- |
| Date | Status | Loan Amount | Loan Type |
|---|---|---|---|
| Open | $359,850 | VA | |
| Previous Owner | $268,654 | VA | |
| Previous Owner | $222,775 | New Conventional |
| Date | Event | Price | List to Sale | Price per Sq Ft |
|---|---|---|---|---|
| 02/11/2026 02/11/26 | Sold | $359,850 | 0.0% | $150 / Sq Ft |
| 12/03/2025 12/03/25 | Pending | -- | -- | -- |
| 11/11/2025 11/11/25 | For Sale | $359,850 | -- | $150 / Sq Ft |
| Year | Tax Paid | Tax Assessment Tax Assessment Total Assessment is a certain percentage of the fair market value that is determined by local assessors to be the total taxable value of land and additions on the property. | Land | Improvement |
|---|---|---|---|---|
| 2025 | $2,643 | $24,850 | $134 | $24,716 |
| 2024 | $2,603 | $24,850 | $134 | $24,716 |
| 2023 | $2,603 | $23,423 | $134 | $23,289 |
| 2022 | $2,559 | $22,741 | $134 | $22,607 |
| 2021 | $2,057 | $22,079 | $134 | $21,945 |
| 2020 | $2,173 | $21,436 | $134 | $21,302 |
| 2019 | $2,211 | $21,675 | $134 | $21,541 |
| 2018 | $2,261 | $21,914 | $134 | $21,780 |
| 2017 | $2,780 | $27,836 | $134 | $27,702 |
| 2016 | $2,913 | $29,669 | $134 | $29,535 |
| 2015 | $2,906 | $29,669 | $134 | $29,535 |
| 2014 | $2,867 | $29,669 | $134 | $29,535 |
Seller's Agent in 2026
Ashlee Jack
(580) 318-0834
459 Total Sales
N
Buyer's Agent in 2026
Non MLS Member
Non-Member Firm
6,067 Total Sales
Source: MLSOK
MLS Number: 1201160
APN: 0076648
Disclaimer: Certain information contained herein is derived from information provided by parties other than Homes.com. All information provided is deemed reliable, but is not guaranteed to be accurate and should be independently verified.
![]() Based on information submitted to the MLS GRID. All data is obtained from various sources and may not have been verified by broker or MLS GRID. Supplied Open House Information is subject to change without notice. All information should be independently reviewed and verified for accuracy. Properties may or may not be listed by the office/agent presenting the information. Some IDX listings have been excluded from this website. IDX information is provided exclusively for personal, non-commercial use, and may not be used for any purpose other than to identify prospective properties consumers may be interested in purchasing.
Based on information submitted to the MLS GRID. All data is obtained from various sources and may not have been verified by broker or MLS GRID. Supplied Open House Information is subject to change without notice. All information should be independently reviewed and verified for accuracy. Properties may or may not be listed by the office/agent presenting the information. Some IDX listings have been excluded from this website. IDX information is provided exclusively for personal, non-commercial use, and may not be used for any purpose other than to identify prospective properties consumers may be interested in purchasing.
Information is deemed reliable but not guaranteed.
This information is not verified for authenticity or accuracy, is not guaranteed and may not reflect all real estate activity in the market.
Copyright 2026 MLSOK, Inc. All rights reserved.
Based on information submitted to the MLS GRID
Ask me questions while you tour the home.