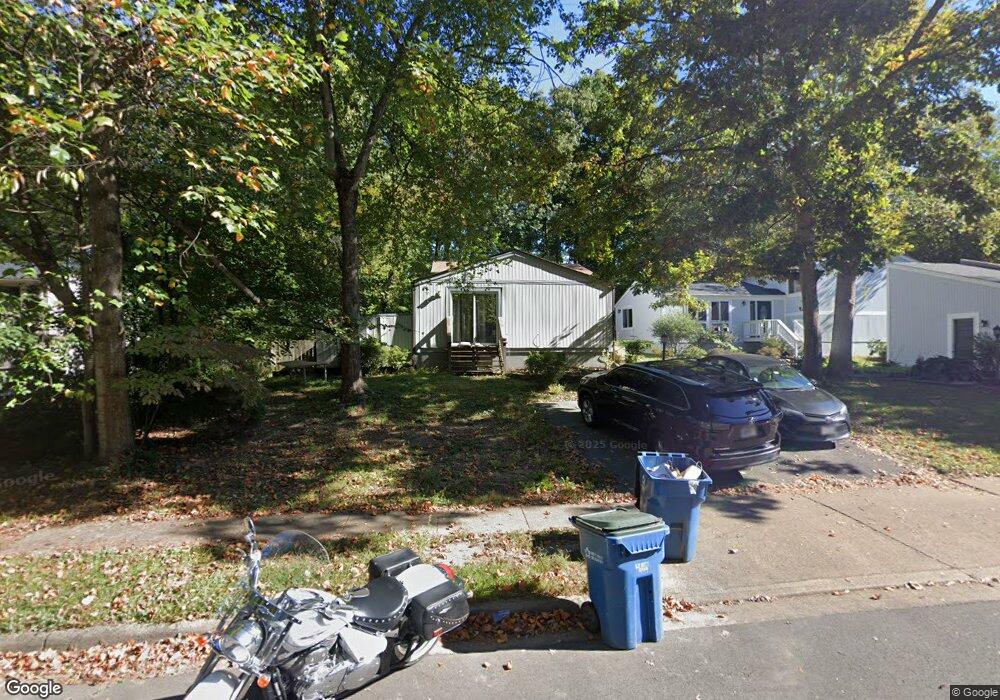
2242 Sanibel Dr Reston, VA 20191
Estimated Value: $485,000 - $652,000
4
Beds
3
Baths
1,248
Sq Ft
$456/Sq Ft
Est. Value
About This Home
This home is located at 2242 Sanibel Dr, Reston, VA 20191 and is currently estimated at $568,502, approximately $455 per square foot. 2242 Sanibel Dr is a home located in Fairfax County with nearby schools including Dogwood Elementary, Langston Hughes Middle School, and South Lakes High School.
Ownership History
Date
Name
Owned For
Owner Type
Purchase Details
Closed on
Mar 17, 2021
Sold by
Vane Natalie S and Schanne Natalie V
Bought by
Schanne Natalie V
Current Estimated Value
Home Financials for this Owner
Home Financials are based on the most recent Mortgage that was taken out on this home.
Original Mortgage
$386,250
Interest Rate
2.5%
Mortgage Type
New Conventional
Purchase Details
Closed on
Nov 17, 2009
Sold by
Deutsche Bank National Trust
Bought by
Vane Natalie S
Purchase Details
Closed on
Sep 16, 2009
Sold by
Muncy Johnie R and Hashime Sayed
Bought by
Deutsche Bank Natl Tr Co
Purchase Details
Closed on
Oct 19, 2005
Sold by
Ayres James R
Bought by
Hashime Sayed Amir and Rahimi,Hashem
Home Financials for this Owner
Home Financials are based on the most recent Mortgage that was taken out on this home.
Original Mortgage
$360,000
Interest Rate
5.72%
Mortgage Type
New Conventional
Create a Home Valuation Report for This Property
The Home Valuation Report is an in-depth analysis detailing your home's value as well as a comparison with similar homes in the area
Home Values in the Area
Average Home Value in this Area
Purchase History
| Date | Buyer | Sale Price | Title Company |
|---|---|---|---|
| Schanne Natalie V | -- | Westcor Land Title | |
| Schanne Natalie V | -- | Westcor Land Title | |
| Schanne Natalie V | -- | Westcor Land Title Ins Co | |
| Vane Natalie S | $255,000 | -- | |
| Deutsche Bank Natl Tr Co | $220,500 | -- | |
| Hashime Sayed Amir | $450,000 | -- |
Source: Public Records
Mortgage History
| Date | Status | Borrower | Loan Amount |
|---|---|---|---|
| Closed | Schanne Natalie V | $386,250 | |
| Closed | Schanne Natalie V | $386,250 | |
| Previous Owner | Hashime Sayed Amir | $360,000 |
Source: Public Records
Tax History Compared to Growth
Tax History
| Year | Tax Paid | Tax Assessment Tax Assessment Total Assessment is a certain percentage of the fair market value that is determined by local assessors to be the total taxable value of land and additions on the property. | Land | Improvement |
|---|---|---|---|---|
| 2025 | $5,484 | $489,990 | $228,000 | $261,990 |
| 2024 | $5,484 | $454,920 | $208,000 | $246,920 |
| 2023 | $5,247 | $446,360 | $208,000 | $238,360 |
| 2022 | $5,277 | $443,230 | $208,000 | $235,230 |
| 2021 | $4,617 | $378,310 | $203,000 | $175,310 |
| 2020 | $4,084 | $331,930 | $163,000 | $168,930 |
| 2019 | $4,053 | $329,340 | $163,000 | $166,340 |
| 2018 | $3,787 | $329,340 | $163,000 | $166,340 |
| 2017 | $3,804 | $314,910 | $158,000 | $156,910 |
| 2016 | $3,878 | $321,680 | $158,000 | $163,680 |
| 2015 | $3,534 | $303,890 | $148,000 | $155,890 |
| 2014 | $3,246 | $279,720 | $138,000 | $141,720 |
Source: Public Records
Map
Nearby Homes
- 12180 Sanibel Ct
- 2269 Marginella Dr
- 2266 White Cornus Ln
- 12154 Captiva Ct
- 2301 Rosedown Dr
- 12271 Turkey Wing Ct
- 2221 Southgate Square
- 2065 Royal Fern Ct Unit 38/12B
- 2042 Royal Fern Ct Unit 1B
- 2245 Hunters Run Dr
- 2038 Royal Fern Ct Unit 2A
- 2273 Hunters Run Dr
- 2033 Royal Fern Ct Unit 49/22B
- 2031 Royal Fern Ct Unit 22B
- 2101 Colts Neck Ct
- 2330 Archdale Rd
- 2109 Colts Neck Ct
- 12492 Fox View Way
- 12399 Brown Fox Way
- 11824 Breton Ct Unit 24A
- 2240 Sanibel Dr
- 2244 Sanibel Dr
- 2246 Sanibel Dr
- 12202 Golden Sands Ln
- 12204 Golden Sands Ln
- 2241 Sanibel Dr
- 2243 Sanibel Dr
- 2248 Sanibel Dr
- 2245 Sanibel Dr
- 12206 Golden Sands Ln
- 2247 Sanibel Dr
- 2249 Sanibel Dr
- 2239 Sanibel Dr
- 2250 Sanibel Dr
- 2251 Sanibel Dr
- 2237 Sanibel Dr
- 2252 Sanibel Dr
- 2235 Sanibel Dr
- 12205 Golden Sands Ln
- 2254 Sanibel Dr