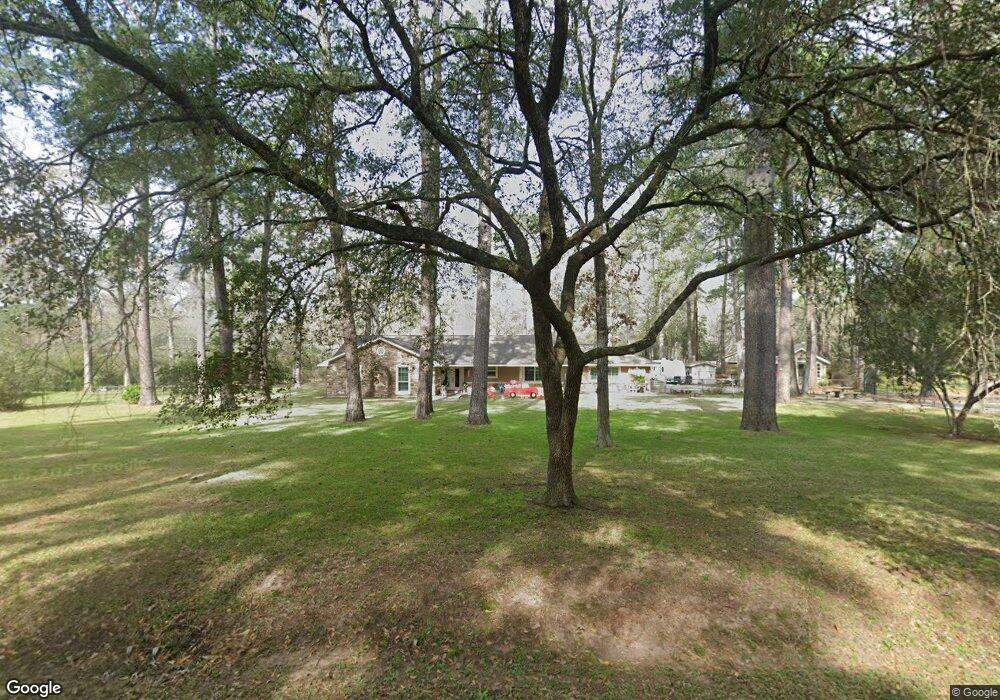
22427 Cardinal Dr Hockley, TX 77447
Estimated Value: $442,000 - $479,000
3
Beds
2
Baths
2,136
Sq Ft
$215/Sq Ft
Est. Value
About This Home
This home is located at 22427 Cardinal Dr, Hockley, TX 77447 and is currently estimated at $459,851, approximately $215 per square foot. 22427 Cardinal Dr is a home located in Harris County with nearby schools including Evelyn Turlington Elementary School, Schultz Junior High School, and Waller High School.
Ownership History
Date
Name
Owned For
Owner Type
Purchase Details
Closed on
Sep 2, 2016
Sold by
Fultz Dwight and Fultz Susan
Bought by
Bokemeyer Russell
Current Estimated Value
Home Financials for this Owner
Home Financials are based on the most recent Mortgage that was taken out on this home.
Original Mortgage
$237,840
Outstanding Balance
$190,099
Interest Rate
3.45%
Mortgage Type
New Conventional
Estimated Equity
$269,752
Purchase Details
Closed on
Apr 24, 2008
Sold by
Burt Charles Franklin and Burt Willie Elaine
Bought by
Fultz Dwight and Fultz Susan
Home Financials for this Owner
Home Financials are based on the most recent Mortgage that was taken out on this home.
Original Mortgage
$179,550
Interest Rate
6.11%
Mortgage Type
Purchase Money Mortgage
Purchase Details
Closed on
Jul 7, 2004
Sold by
Southwest Estate Services Inc
Bought by
Burt Charles Franklin and Burt Willie Elaine
Create a Home Valuation Report for This Property
The Home Valuation Report is an in-depth analysis detailing your home's value as well as a comparison with similar homes in the area
Home Values in the Area
Average Home Value in this Area
Purchase History
| Date | Buyer | Sale Price | Title Company |
|---|---|---|---|
| Bokemeyer Russell | -- | None Available | |
| Fultz Dwight | -- | Stewart Title Houston Div | |
| Burt Charles Franklin | -- | -- |
Source: Public Records
Mortgage History
| Date | Status | Borrower | Loan Amount |
|---|---|---|---|
| Open | Bokemeyer Russell | $237,840 | |
| Previous Owner | Fultz Dwight | $179,550 |
Source: Public Records
Tax History Compared to Growth
Tax History
| Year | Tax Paid | Tax Assessment Tax Assessment Total Assessment is a certain percentage of the fair market value that is determined by local assessors to be the total taxable value of land and additions on the property. | Land | Improvement |
|---|---|---|---|---|
| 2025 | $1,494 | $371,610 | $106,188 | $265,422 |
| 2024 | $1,494 | $361,772 | $106,188 | $255,584 |
| 2023 | $1,494 | $349,787 | $70,792 | $278,995 |
| 2022 | $522 | $313,689 | $70,792 | $242,897 |
| 2021 | $5,073 | $240,940 | $70,792 | $170,148 |
| 2020 | $5,269 | $240,940 | $70,792 | $170,148 |
| 2019 | $5,230 | $258,372 | $53,094 | $205,278 |
| 2018 | $459 | $208,983 | $38,936 | $170,047 |
| 2017 | $4,671 | $208,983 | $38,936 | $170,047 |
| 2016 | $3,796 | $178,671 | $38,936 | $139,735 |
| 2015 | $865 | $178,671 | $38,936 | $139,735 |
| 2014 | $865 | $140,353 | $35,396 | $104,957 |
Source: Public Records
Map
Nearby Homes
- 23114 Cardinal Dr
- 20306 Courageous Dr
- 21815 Fearless Dr
- 22019 Robins Rd
- 21334 Farm To Market Road 2920
- TBD Farm To Market Road 2920
- 20719 New Kentucky Village Dr
- 21010 Red Arbutus Ct
- 22327 Three Pines Dr
- 21310 Barcelona Heights Trail
- 23515 Cardinal Dr
- 20910 Holm Oak Way
- 21843 Carballo Oak Trail
- 0 Roberts Cemetery Rd Unit 36689208
- 21914 Hibiscus Hedge Trail
- 21410 Villa Spruce Ln
- 21006 Yellow Ipe Grove Ct
- 21002 Yellow Ipe Grove Ct
- 21439 Jacaranda Blossom Way
- 21438 Jacaranda Blossom Way
- 22419 Cardinal Dr
- 22603 Thrush Trail
- 22418 Cardinal Dr
- 22411 Cardinal Dr
- 21018 Warbler Way
- 22503 Cardinal Dr
- 22715 Cardinal Dr
- 22615 Cardinal Dr
- 22522 Cardinal Dr
- 21002 Warbler Way
- 22323 Cardinal Dr
- 22821 Cardinal Dr
- 00 Warbler Way
- 20914 Warbler Way
- 22319 Cardinal Dr
- 21011 Warbler Way
- 21011 Warbler Way
- 22827 Cardinal Dr
- 21603 Fearless Dr
- 20918 Warbler Way