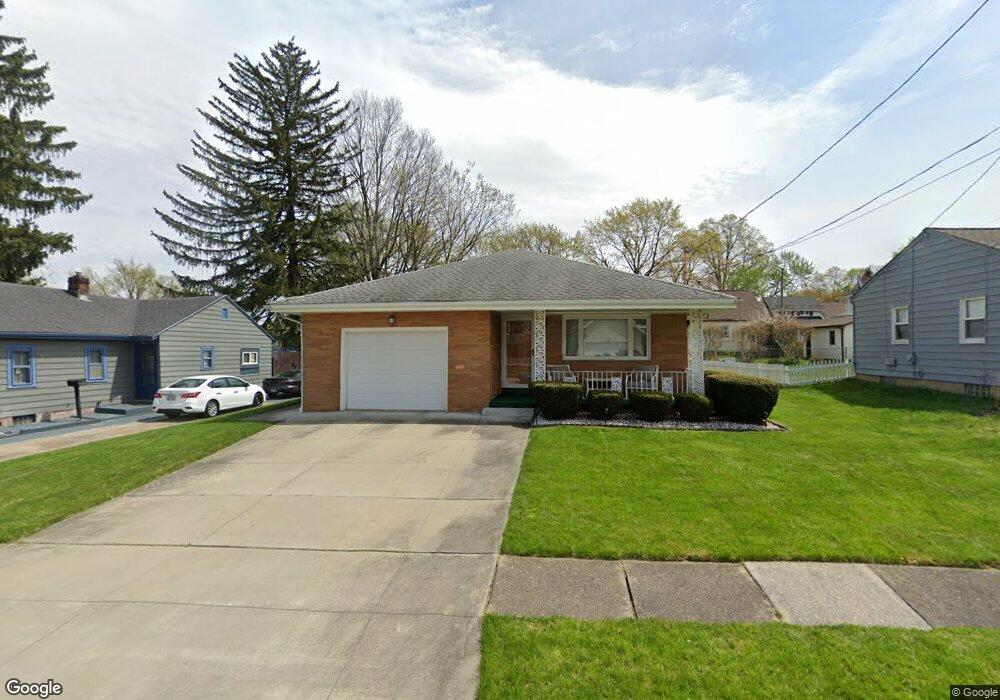
2243 10th St Cuyahoga Falls, OH 44221
Phelps Avenue NeighborhoodEstimated Value: $174,000 - $229,000
3
Beds
1
Bath
1,216
Sq Ft
$169/Sq Ft
Est. Value
About This Home
This home is located at 2243 10th St, Cuyahoga Falls, OH 44221 and is currently estimated at $205,770, approximately $169 per square foot. 2243 10th St is a home located in Summit County with nearby schools including Dewitt Elementary School, Bolich Middle School, and Cuyahoga Falls High School.
Ownership History
Date
Name
Owned For
Owner Type
Purchase Details
Closed on
Dec 14, 2020
Sold by
Wyszynski Terry and Wzszynski Terry
Bought by
Basone Daniel A
Current Estimated Value
Home Financials for this Owner
Home Financials are based on the most recent Mortgage that was taken out on this home.
Original Mortgage
$125,000
Outstanding Balance
$111,486
Interest Rate
2.8%
Mortgage Type
New Conventional
Estimated Equity
$94,284
Purchase Details
Closed on
Jul 9, 2020
Sold by
Dorothy Wyszynski
Bought by
Wzszynski Terry
Create a Home Valuation Report for This Property
The Home Valuation Report is an in-depth analysis detailing your home's value as well as a comparison with similar homes in the area
Home Values in the Area
Average Home Value in this Area
Purchase History
| Date | Buyer | Sale Price | Title Company |
|---|---|---|---|
| Basone Daniel A | $135,000 | None Available | |
| Wzszynski Terry | -- | -- |
Source: Public Records
Mortgage History
| Date | Status | Borrower | Loan Amount |
|---|---|---|---|
| Open | Basone Daniel A | $125,000 |
Source: Public Records
Tax History Compared to Growth
Tax History
| Year | Tax Paid | Tax Assessment Tax Assessment Total Assessment is a certain percentage of the fair market value that is determined by local assessors to be the total taxable value of land and additions on the property. | Land | Improvement |
|---|---|---|---|---|
| 2025 | $3,558 | $65,913 | $11,554 | $54,359 |
| 2024 | $3,558 | $65,913 | $11,554 | $54,359 |
| 2023 | $3,558 | $65,913 | $11,554 | $54,359 |
| 2022 | $3,063 | $46,096 | $8,082 | $38,014 |
| 2021 | $3,056 | $45,987 | $8,082 | $37,905 |
| 2020 | $2,434 | $45,990 | $8,080 | $37,910 |
| 2019 | $2,234 | $39,880 | $7,920 | $31,960 |
| 2018 | $1,897 | $39,880 | $7,920 | $31,960 |
| 2017 | $1,872 | $39,880 | $7,920 | $31,960 |
| 2016 | $1,874 | $39,880 | $7,920 | $31,960 |
| 2015 | $1,872 | $39,880 | $7,920 | $31,960 |
| 2014 | $1,873 | $39,880 | $7,920 | $31,960 |
| 2013 | $1,857 | $39,880 | $7,920 | $31,960 |
Source: Public Records
Map
Nearby Homes