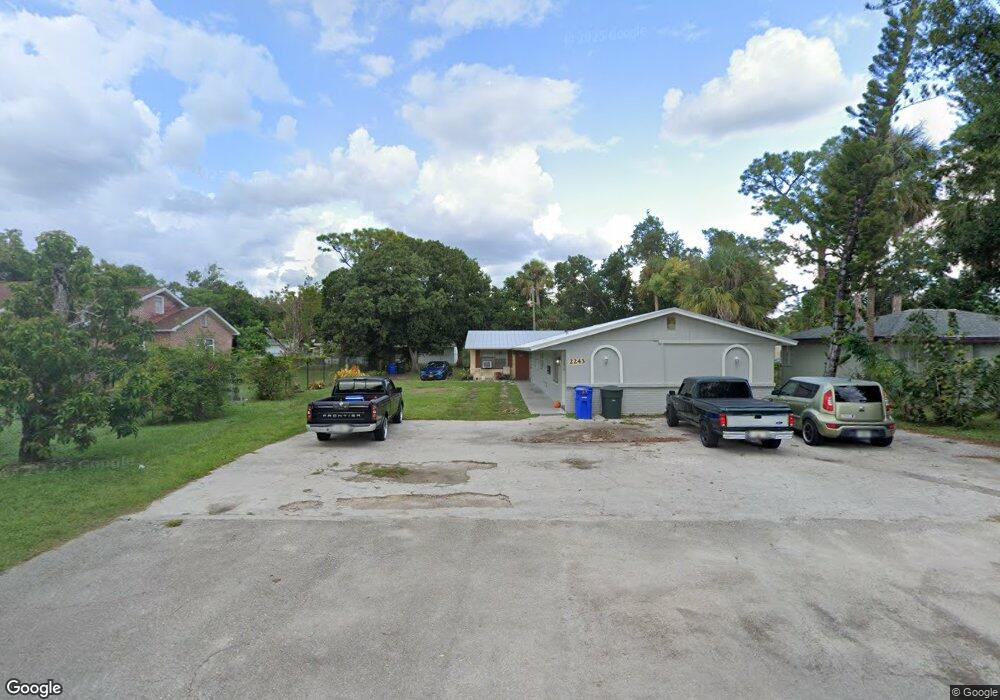
2243-2247 South St Fort Myers, FL 33901
Estimated Value: $279,000 - $372,000
4
Beds
3
Baths
2,400
Sq Ft
$134/Sq Ft
Est. Value
About This Home
This home is located at 2243-2247 South St, Fort Myers, FL 33901 and is currently estimated at $322,333, approximately $134 per square foot. 2243-2247 South St is a home located in Lee County with nearby schools including Edison Park Creative & Expressive Arts School, Allen Park Elementary School, and Orangewood Elementary School.
Ownership History
Date
Name
Owned For
Owner Type
Purchase Details
Closed on
Jun 21, 2022
Sold by
Gregory Hennen
Bought by
Dl Rental Holding Llc
Current Estimated Value
Home Financials for this Owner
Home Financials are based on the most recent Mortgage that was taken out on this home.
Original Mortgage
$175,500
Interest Rate
5.3%
Mortgage Type
Construction
Purchase Details
Closed on
Dec 6, 2007
Sold by
Layne Jonathan T
Bought by
Brown Molly and Hennen Greg J
Purchase Details
Closed on
Aug 30, 2002
Sold by
Hamid Erfan M and Hamid Shaharazad M
Bought by
Layne Jonathan T
Home Financials for this Owner
Home Financials are based on the most recent Mortgage that was taken out on this home.
Original Mortgage
$103,500
Interest Rate
6.31%
Mortgage Type
Commercial
Purchase Details
Closed on
Jul 24, 1996
Sold by
Marchand Phyllis and Giambrone Michael R
Bought by
Hamid Erfan M and Hamid Shaharazad M
Create a Home Valuation Report for This Property
The Home Valuation Report is an in-depth analysis detailing your home's value as well as a comparison with similar homes in the area
Home Values in the Area
Average Home Value in this Area
Purchase History
| Date | Buyer | Sale Price | Title Company |
|---|---|---|---|
| Dl Rental Holding Llc | $160,000 | Wright Law Firm Pa | |
| Brown Molly | $155,000 | Attorney | |
| Layne Jonathan T | $115,000 | -- | |
| Hamid Erfan M | $67,400 | -- |
Source: Public Records
Mortgage History
| Date | Status | Borrower | Loan Amount |
|---|---|---|---|
| Closed | Dl Rental Holding Llc | $175,500 | |
| Previous Owner | Layne Jonathan T | $103,500 |
Source: Public Records
Tax History Compared to Growth
Tax History
| Year | Tax Paid | Tax Assessment Tax Assessment Total Assessment is a certain percentage of the fair market value that is determined by local assessors to be the total taxable value of land and additions on the property. | Land | Improvement |
|---|---|---|---|---|
| 2025 | $5,779 | $267,664 | -- | -- |
| 2024 | $5,779 | $243,331 | -- | -- |
| 2023 | $5,349 | $221,210 | $11,936 | $222,354 |
| 2022 | $3,774 | $81,607 | $0 | $0 |
| 2021 | $3,443 | $166,208 | $9,341 | $156,867 |
| 2020 | $2,885 | $134,045 | $7,200 | $126,845 |
| 2019 | $2,707 | $118,706 | $3,400 | $115,306 |
| 2018 | $2,608 | $108,197 | $3,400 | $104,797 |
| 2017 | $2,366 | $81,555 | $3,400 | $78,155 |
| 2016 | $2,283 | $79,489 | $3,915 | $75,574 |
| 2015 | $2,068 | $71,998 | $3,434 | $68,564 |
| 2014 | -- | $44,292 | $3,241 | $41,051 |
| 2013 | -- | $55,204 | $3,420 | $51,784 |
Source: Public Records
Map
Nearby Homes
- 2217 Dora St
- 2165 South St
- 2269 Katherine St
- 2316 Willard St
- 2223 Katherine St
- 2729 Broadway
- 2105 Franklin St
- 2156 Edison Ave
- 2403 Stella St
- 2428 Stella St
- 2828 Jackson St Unit I3
- 2828 Jackson St Unit M5
- 2828 Jackson St Unit I4
- 2828 Jackson St Unit C5
- 2828 Jackson St Unit H5
- 2828 Jackson St Unit F-7
- 2828 Jackson St Unit E6
- 2767 Central Ave
- 2816 Central Ave
- 2357 Crawford St