2243 Oberlin Dr Unit 434A Woodbridge, VA 22191
Stonebridge NeighborhoodEstimated Value: $481,000 - $503,000
3
Beds
3
Baths
2,133
Sq Ft
$232/Sq Ft
Est. Value
About This Home
This home is located at 2243 Oberlin Dr Unit 434A, Woodbridge, VA 22191 and is currently estimated at $495,062, approximately $232 per square foot. 2243 Oberlin Dr Unit 434A is a home located in Prince William County with nearby schools including Fannie W. Fitzgerald Elementary School, Rippon Middle School, and Freedom High School.
Ownership History
Date
Name
Owned For
Owner Type
Purchase Details
Closed on
Dec 27, 2024
Sold by
Bayne William
Bought by
Romero Karen Alicia Fuent and Kendall David M
Current Estimated Value
Home Financials for this Owner
Home Financials are based on the most recent Mortgage that was taken out on this home.
Original Mortgage
$481,124
Outstanding Balance
$477,802
Interest Rate
6.84%
Mortgage Type
FHA
Estimated Equity
$17,260
Purchase Details
Closed on
Aug 1, 2018
Sold by
Mcdonald Lisa L
Bought by
Bayne William
Purchase Details
Closed on
Nov 7, 2008
Sold by
Pulte Home Corp
Bought by
Mcdonald Lisa L
Home Financials for this Owner
Home Financials are based on the most recent Mortgage that was taken out on this home.
Original Mortgage
$338,295
Interest Rate
6.08%
Mortgage Type
VA
Create a Home Valuation Report for This Property
The Home Valuation Report is an in-depth analysis detailing your home's value as well as a comparison with similar homes in the area
Home Values in the Area
Average Home Value in this Area
Purchase History
| Date | Buyer | Sale Price | Title Company |
|---|---|---|---|
| Romero Karen Alicia Fuent | $495,000 | Kvs Title | |
| Romero Karen Alicia Fuent | $495,000 | Kvs Title | |
| Romero Karen Alicia Fuent | $495,000 | Kvs Title | |
| Bayne William | $315,000 | Chicago Title | |
| Mcdonald Lisa L | $331,175 | -- |
Source: Public Records
Mortgage History
| Date | Status | Borrower | Loan Amount |
|---|---|---|---|
| Open | Romero Karen Alicia Fuent | $481,124 | |
| Closed | Romero Karen Alicia Fuent | $481,124 | |
| Previous Owner | Mcdonald Lisa L | $338,295 |
Source: Public Records
Tax History Compared to Growth
Tax History
| Year | Tax Paid | Tax Assessment Tax Assessment Total Assessment is a certain percentage of the fair market value that is determined by local assessors to be the total taxable value of land and additions on the property. | Land | Improvement |
|---|---|---|---|---|
| 2025 | $4,226 | $453,800 | $132,000 | $321,800 |
| 2024 | $4,226 | $424,900 | $123,400 | $301,500 |
| 2023 | $4,193 | $403,000 | $116,400 | $286,600 |
| 2022 | $4,315 | $389,600 | $111,900 | $277,700 |
| 2021 | $4,185 | $343,100 | $98,200 | $244,900 |
| 2020 | $4,932 | $318,200 | $90,100 | $228,100 |
| 2019 | $4,768 | $307,600 | $87,500 | $220,100 |
| 2018 | $3,496 | $289,500 | $83,300 | $206,200 |
| 2017 | $3,512 | $284,700 | $81,700 | $203,000 |
| 2016 | $3,421 | $279,900 | $80,100 | $199,800 |
| 2015 | $3,407 | $280,700 | $80,100 | $200,600 |
| 2014 | $3,407 | $272,800 | $77,000 | $195,800 |
Source: Public Records
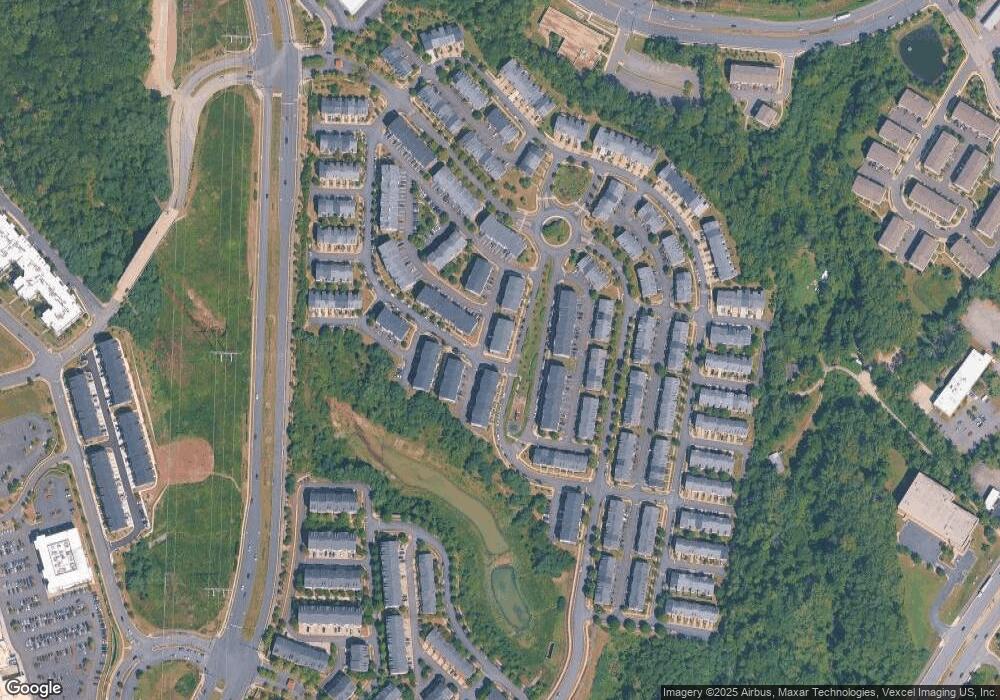
Map
Nearby Homes
- 14782 Potomac Branch Dr
- 14819 Potomac Branch Dr
- 14762 Potomac Branch Dr
- 2400 Brookmoor Ln
- 2576 Eastbourne Dr
- 2595 Eastbourne Dr
- 2488 Eastbourne Dr Unit 313
- 15177 Lancashire Dr Unit 350
- 14766 Malloy Ct
- 2707 Sheffield Hill Way
- 2689 Sheffield Hill Way
- 2675 Sheffield Hill Way Unit 164
- 2667 Sheffield Hill Way Unit 168
- 14762 Mason Creek Cir
- 15227 Lancashire Dr Unit 372
- 2246 Margraf Cir
- 14738 Mason Creek Cir Unit 29
- 14718 Mason Creek Cir
- 2331 Kew Gardens Dr
- 15240 Torbay Way
- 2241 Oberlin Dr
- 2245 Oberlin Dr Unit 435A
- 2245 Oberlin Dr
- 2247 Oberlin Dr
- 2247 Oberlin Dr Unit 436A
- 2251 Oberlin Dr
- 2249 Oberlin Dr
- 2253 Oberlin Dr Unit 439A
- 2253 Oberlin Dr
- 2255 Oberlin Dr
- 2255 Oberlin Dr Unit 440A
- 2237 Oberlin Dr Unit 340A
- 2237 Oberlin Dr Unit 340PA
- 2235 Oberlin Dr Unit 339A
- 2326 Brookmoor Ln
- 2324 Brookmoor Ln
- 2324 Brookmoor Ln Unit 371A
- 2233 Oberlin Dr Unit 338A
- 2231 Oberlin Dr Unit 337A
- 2261 Oberlin Dr