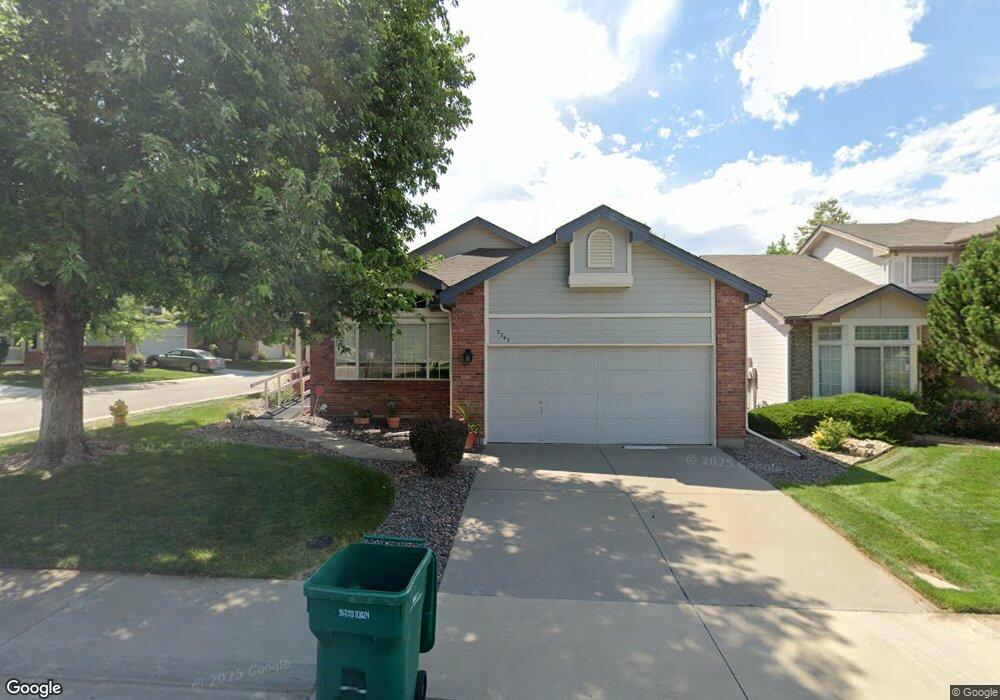
2243 S Moline Ct Aurora, CO 80014
Village East NeighborhoodEstimated Value: $472,557 - $497,000
3
Beds
3
Baths
1,794
Sq Ft
$268/Sq Ft
Est. Value
About This Home
This home is located at 2243 S Moline Ct, Aurora, CO 80014 and is currently estimated at $481,639, approximately $268 per square foot. 2243 S Moline Ct is a home located in Arapahoe County with nearby schools including Ponderosa Elementary School, Prairie Middle School, and Overland High School.
Ownership History
Date
Name
Owned For
Owner Type
Purchase Details
Closed on
Jun 30, 2021
Sold by
Charter Robert A and Charter Cheri B
Bought by
Aumiller Kevin and Mccarty Erin
Current Estimated Value
Home Financials for this Owner
Home Financials are based on the most recent Mortgage that was taken out on this home.
Original Mortgage
$345,100
Outstanding Balance
$310,396
Interest Rate
2.9%
Mortgage Type
New Conventional
Estimated Equity
$171,243
Purchase Details
Closed on
Aug 26, 1992
Sold by
Conversion Arapco
Bought by
Charter Cheri B Charter Robert A
Purchase Details
Closed on
Nov 5, 1991
Bought by
Conversion Arapco
Create a Home Valuation Report for This Property
The Home Valuation Report is an in-depth analysis detailing your home's value as well as a comparison with similar homes in the area
Home Values in the Area
Average Home Value in this Area
Purchase History
| Date | Buyer | Sale Price | Title Company |
|---|---|---|---|
| Aumiller Kevin | $385,100 | Land Title Guarantee Company | |
| Charter Cheri B Charter Robert A | -- | -- | |
| Conversion Arapco | -- | -- |
Source: Public Records
Mortgage History
| Date | Status | Borrower | Loan Amount |
|---|---|---|---|
| Open | Aumiller Kevin | $345,100 |
Source: Public Records
Tax History Compared to Growth
Tax History
| Year | Tax Paid | Tax Assessment Tax Assessment Total Assessment is a certain percentage of the fair market value that is determined by local assessors to be the total taxable value of land and additions on the property. | Land | Improvement |
|---|---|---|---|---|
| 2025 | $2,596 | $32,463 | -- | -- |
| 2024 | $2,289 | $33,085 | -- | -- |
| 2023 | $2,289 | $33,085 | $0 | $0 |
| 2022 | $1,939 | $26,764 | $0 | $0 |
| 2021 | $1,444 | $26,764 | $0 | $0 |
| 2020 | $1,609 | $29,558 | $0 | $0 |
| 2019 | $1,553 | $29,558 | $0 | $0 |
| 2018 | $1,192 | $23,364 | $0 | $0 |
| 2017 | $1,175 | $23,364 | $0 | $0 |
| 2016 | $1,085 | $21,962 | $0 | $0 |
| 2015 | $1,032 | $21,962 | $0 | $0 |
| 2014 | -- | $15,323 | $0 | $0 |
| 2013 | -- | $16,460 | $0 | $0 |
Source: Public Records
Map
Nearby Homes
- 2238 S Nile Ct
- 11303 E Warren Ave
- 11183 E Baltic Place
- 11190 E Wesley Ave
- 2280 S Oswego Way Unit 104
- 2280 S Oswego Way Unit 105
- 2275 S Kenton St
- 2210 S Joliet Way
- 2450 S Oswego St
- 1968 S Kingston Ct
- 1958 S Kingston Ct
- 1967 S Kingston Ct
- 12003 E Harvard Ave Unit 206
- 11132 E Harvard Dr
- 11905 E Harvard Ave Unit 108
- 11911 E Harvard Ave Unit 103
- 12053 E Harvard Ave Unit 107
- 11742 E Jewell Place
- 2218 S Iola St
- 1997 S Peoria St
- 2241 S Moline Ct
- 2242 S Macon Ct
- 2231 S Moline Ct
- 2240 S Macon Ct
- 11498 E Baltic Place
- 11468 E Baltic Place
- 2242 S Moline Ct
- 11510 E Baltic Place
- 11438 E Baltic Place
- 2230 S Macon Ct
- 2232 S Moline Ct
- 2221 S Moline Ct
- 11550 E Baltic Place
- 2222 S Moline Ct
- 11408 E Baltic Place
- 2220 S Macon Ct
- 2211 S Moline Ct
- 11590 E Baltic Place
- 2212 S Moline Ct
- 11396 E Baltic Place