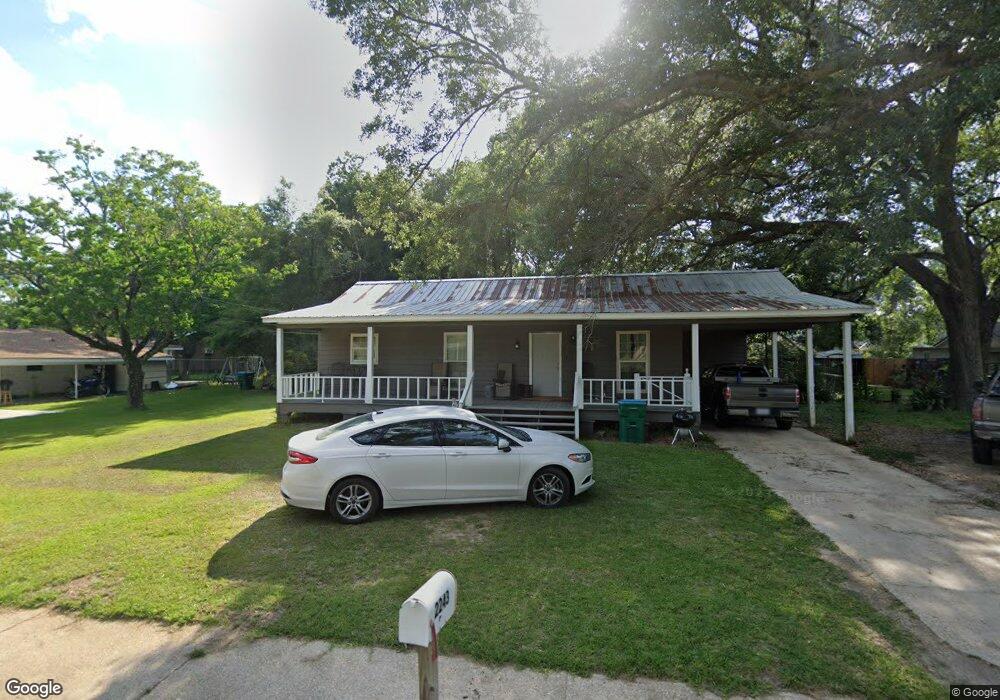
2243 S Woodcrest Ave Denham Springs, LA 70726
Estimated Value: $147,000 - $186,000
2
Beds
2
Baths
982
Sq Ft
$163/Sq Ft
Est. Value
About This Home
This home is located at 2243 S Woodcrest Ave, Denham Springs, LA 70726 and is currently estimated at $159,654, approximately $162 per square foot. 2243 S Woodcrest Ave is a home located in Livingston Parish with nearby schools including Southside Elementary School, Southside Junior High School, and Denham Springs Freshman High School.
Ownership History
Date
Name
Owned For
Owner Type
Purchase Details
Closed on
Aug 13, 2015
Sold by
Sweet Vibrations Llc
Bought by
Keating Chris G and Keating Tessie Sims
Current Estimated Value
Purchase Details
Closed on
Jan 21, 2010
Sold by
Advanced Exit Strategies Llc
Bought by
Sweet Vibrations Llc
Home Financials for this Owner
Home Financials are based on the most recent Mortgage that was taken out on this home.
Original Mortgage
$58,840
Interest Rate
12%
Mortgage Type
Unknown
Purchase Details
Closed on
Mar 16, 2007
Sold by
Shelton Wallace Carolyn Kay and Turner Scott Alan
Bought by
Saia Anthony and Saia Maria Picenni
Home Financials for this Owner
Home Financials are based on the most recent Mortgage that was taken out on this home.
Original Mortgage
$82,650
Interest Rate
6.3%
Mortgage Type
New Conventional
Create a Home Valuation Report for This Property
The Home Valuation Report is an in-depth analysis detailing your home's value as well as a comparison with similar homes in the area
Home Values in the Area
Average Home Value in this Area
Purchase History
| Date | Buyer | Sale Price | Title Company |
|---|---|---|---|
| Keating Chris G | $65,000 | Professional Title Of La Inc | |
| Sweet Vibrations Llc | $65,000 | Accent Title Llc | |
| Advanced Exit Strategies Llc | $57,000 | Accent Title Llc | |
| Saia Anthony | $87,000 | Cypress Title |
Source: Public Records
Mortgage History
| Date | Status | Borrower | Loan Amount |
|---|---|---|---|
| Previous Owner | Advanced Exit Strategies Llc | $58,840 | |
| Previous Owner | Saia Anthony | $82,650 |
Source: Public Records
Tax History Compared to Growth
Tax History
| Year | Tax Paid | Tax Assessment Tax Assessment Total Assessment is a certain percentage of the fair market value that is determined by local assessors to be the total taxable value of land and additions on the property. | Land | Improvement |
|---|---|---|---|---|
| 2024 | $942 | $9,859 | $1,200 | $8,659 |
| 2023 | $785 | $7,310 | $1,200 | $6,110 |
| 2022 | $791 | $7,310 | $1,200 | $6,110 |
| 2021 | $794 | $7,310 | $1,200 | $6,110 |
| 2020 | $800 | $7,310 | $1,200 | $6,110 |
| 2019 | $600 | $5,300 | $1,200 | $4,100 |
| 2018 | $607 | $5,300 | $1,200 | $4,100 |
| 2017 | $582 | $5,100 | $1,200 | $3,900 |
| 2015 | $899 | $7,840 | $1,200 | $6,640 |
| 2014 | $921 | $7,840 | $1,200 | $6,640 |
Source: Public Records
Map
Nearby Homes
- 2232 Connie Dr
- 2149 Connie Dr
- 2081 S Woodcrest St
- 2060 S Woodcrest St
- 21123 Louisiana 1032
- 24905 Louisiana 1032
- 1.95 acres Louisiana 1032
- 8287, 8353 Rushing Rd
- 0 4-H Club Rd Unit 2023018294
- 2025 Falconcrest Dr
- 1771 N Woodcrest Ave
- 2445 Sherry St
- 26876 Louisiana 1032
- 378 Rushing Rd W
- 1559 Brookfield Dr
- Lot 15 Veterans Blvd
- Lot 2 Veterans Blvd
- Lot 5-A-3 Veterans Blvd
- Lot 18-B-2 Veterans Blvd
- 731 Castlewood St
- 2243 S Woodcrest St
- 2301 S Woodcrest Ave
- 2301 S Woodcrest St
- 2241 S Woodcrest St
- 2250 S Woodcrest St
- 2250 S Woodcrest St
- 2311 S Woodcrest St
- 2311 S Woodcrest Ave
- 2231 S Woodcrest Ave
- 2231 S Woodcrest St
- 2230 S Woodcrest St
- 2230 S Woodcrest Ave
- 651 Carol Sue St
- 2321 S Woodcrest St
- 2226 Connie Dr
- 652 Carol Sue St
- 2310 S Woodcrest St
- 649 Carol Sue St
- 2221 S Woodcrest St
- 2221 S Woodcrest Ave