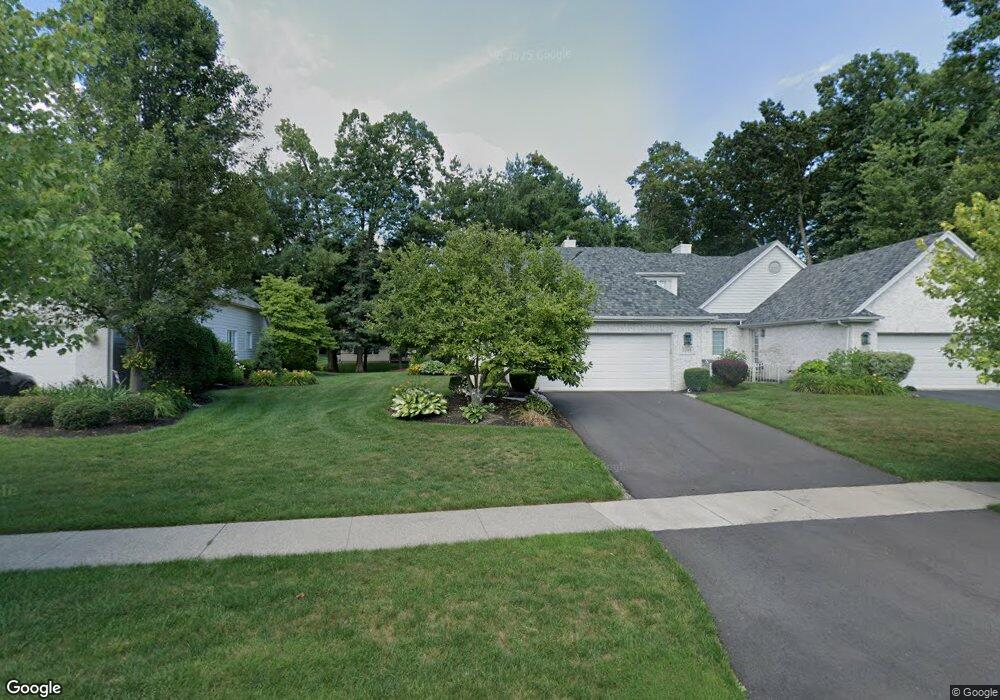
2244 Birch Run Ct Sylvania, OH 43560
Estimated Value: $402,000 - $414,969
3
Beds
3
Baths
2,531
Sq Ft
$161/Sq Ft
Est. Value
About This Home
This home is located at 2244 Birch Run Ct, Sylvania, OH 43560 and is currently estimated at $406,242, approximately $160 per square foot. 2244 Birch Run Ct is a home located in Lucas County with nearby schools including Central Trail Elementary School, Sylvania Timberstone Junior High School, and Sylvania Southview High School.
Ownership History
Date
Name
Owned For
Owner Type
Purchase Details
Closed on
Feb 15, 2018
Sold by
Genide Farris L
Bought by
Genide Brain M and Jensen Andrea B
Current Estimated Value
Purchase Details
Closed on
Mar 15, 2006
Sold by
Mousseau Carlton and Mousseau Patricia J
Bought by
Genide Farris L
Home Financials for this Owner
Home Financials are based on the most recent Mortgage that was taken out on this home.
Original Mortgage
$196,000
Outstanding Balance
$111,815
Interest Rate
6.33%
Mortgage Type
Purchase Money Mortgage
Estimated Equity
$294,427
Purchase Details
Closed on
Feb 23, 1999
Sold by
Tay Cor Inc
Bought by
Steiger Robert C and Steiger Jane M
Home Financials for this Owner
Home Financials are based on the most recent Mortgage that was taken out on this home.
Original Mortgage
$259,000
Interest Rate
8.5%
Mortgage Type
Seller Take Back
Create a Home Valuation Report for This Property
The Home Valuation Report is an in-depth analysis detailing your home's value as well as a comparison with similar homes in the area
Home Values in the Area
Average Home Value in this Area
Purchase History
| Date | Buyer | Sale Price | Title Company |
|---|---|---|---|
| Genide Brain M | -- | None Available | |
| Genide Farris L | $245,000 | None Available | |
| Steiger Robert C | $264,000 | -- |
Source: Public Records
Mortgage History
| Date | Status | Borrower | Loan Amount |
|---|---|---|---|
| Open | Genide Farris L | $196,000 | |
| Previous Owner | Steiger Robert C | $259,000 |
Source: Public Records
Tax History Compared to Growth
Tax History
| Year | Tax Paid | Tax Assessment Tax Assessment Total Assessment is a certain percentage of the fair market value that is determined by local assessors to be the total taxable value of land and additions on the property. | Land | Improvement |
|---|---|---|---|---|
| 2024 | $4,151 | $137,200 | $26,215 | $110,985 |
| 2023 | $7,836 | $112,210 | $21,945 | $90,265 |
| 2022 | $7,865 | $112,210 | $21,945 | $90,265 |
| 2021 | $8,051 | $112,210 | $21,945 | $90,265 |
| 2020 | $8,527 | $105,910 | $21,000 | $84,910 |
| 2019 | $8,216 | $105,910 | $21,000 | $84,910 |
| 2018 | $7,403 | $105,910 | $21,000 | $84,910 |
| 2017 | $7,136 | $85,365 | $20,825 | $64,540 |
| 2016 | $6,998 | $243,900 | $59,500 | $184,400 |
| 2015 | $6,604 | $243,900 | $59,500 | $184,400 |
| 2014 | $6,167 | $82,080 | $20,020 | $62,060 |
| 2013 | $6,167 | $82,080 | $20,020 | $62,060 |
Source: Public Records
Map
Nearby Homes
- 8655 Big Cypress Cir
- 8828 Cedar Bend Rd
- 8740 Dorr St
- 8526 W Bancroft St
- 2906 Elmwood Dr
- 1021 N Crissey Rd
- 2946 Elmwood Dr
- 8760 Nebraska Ave
- 8946 Frankfort Rd
- 9627 Dorr St
- 2051 Centennial Rd
- 2954 Shetland Rd
- 17 Stone Oak Blvd
- 2637 Heysler Rd
- 8670 Augusta Ln
- 9209 Mile View Ct
- 9210 Mile View Ct
- 9216 Mile View Ct
- 9222 Mile View Ct
- 9151 Mile View Ct
- 2238 Birch Run Ct
- 2250 Birch Run Ct
- 8913 Sycamore Trail
- 2256 Birch Run Ct
- 2232 Birch Run Ct
- 8907 Sycamore Trail
- 8919 Sycamore Trail
- 2226 Birch Run Ct
- 2300 Birch Run Ct
- 2245 Birch Run Ct
- 8925 Sycamore Trail
- 2243 Stonybrook Blvd
- 2251 Birch Run Ct
- 2233 Stonybrook Blvd
- 8901 Sycamore Trail
- 2220 Birch Run Ct
- 2306 Birch Run Ct
- 2225 Birch Run Ct
- 2229 Stonybrook Blvd
- 8931 Sycamore Trail