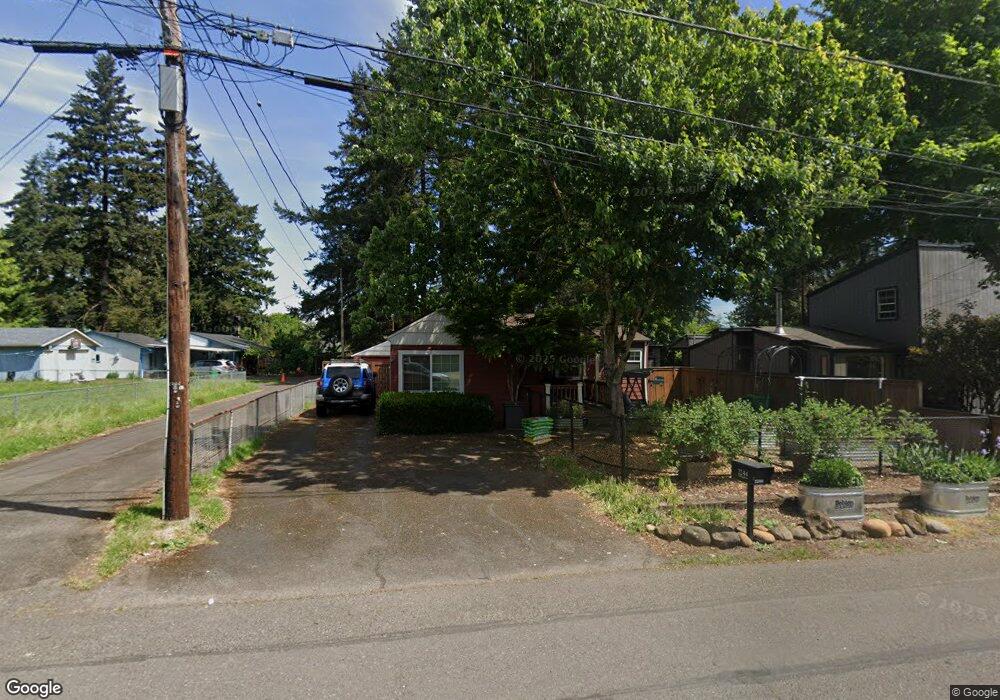
2244 SE 142nd Ave Portland, OR 97233
Centennial NeighborhoodEstimated Value: $346,062 - $413,000
3
Beds
1
Bath
885
Sq Ft
$423/Sq Ft
Est. Value
About This Home
This home is located at 2244 SE 142nd Ave, Portland, OR 97233 and is currently estimated at $374,516, approximately $423 per square foot. 2244 SE 142nd Ave is a home located in Multnomah County with nearby schools including Lincoln Park Elementary School, Ron Russell Middle School, and David Douglas High School.
Ownership History
Date
Name
Owned For
Owner Type
Purchase Details
Closed on
Jun 23, 2010
Sold by
David Mitchel H
Bought by
David Mitchel H and Kirby Melissa
Current Estimated Value
Home Financials for this Owner
Home Financials are based on the most recent Mortgage that was taken out on this home.
Original Mortgage
$135,150
Outstanding Balance
$90,311
Interest Rate
4.91%
Mortgage Type
New Conventional
Estimated Equity
$284,205
Purchase Details
Closed on
Mar 10, 1997
Sold by
Ocwen Federal Bank Fsb
Bought by
David Mitchel H
Home Financials for this Owner
Home Financials are based on the most recent Mortgage that was taken out on this home.
Original Mortgage
$88,650
Interest Rate
7%
Mortgage Type
Purchase Money Mortgage
Purchase Details
Closed on
Oct 11, 1996
Sold by
Cooper Charles B
Bought by
Ocwen Federal Bank Fsb
Purchase Details
Closed on
Oct 27, 1995
Sold by
Harbick Jim
Bought by
Cooper Charles B
Create a Home Valuation Report for This Property
The Home Valuation Report is an in-depth analysis detailing your home's value as well as a comparison with similar homes in the area
Home Values in the Area
Average Home Value in this Area
Purchase History
| Date | Buyer | Sale Price | Title Company |
|---|---|---|---|
| David Mitchel H | -- | Ticor Title | |
| David Mitchel H | $98,500 | Ticor Title Insurance | |
| Ocwen Federal Bank Fsb | $65,097 | Chicago Title | |
| Cooper Charles B | $15,000 | Chicago Title Insurance Co |
Source: Public Records
Mortgage History
| Date | Status | Borrower | Loan Amount |
|---|---|---|---|
| Open | David Mitchel H | $135,150 | |
| Closed | David Mitchel H | $88,650 |
Source: Public Records
Tax History Compared to Growth
Tax History
| Year | Tax Paid | Tax Assessment Tax Assessment Total Assessment is a certain percentage of the fair market value that is determined by local assessors to be the total taxable value of land and additions on the property. | Land | Improvement |
|---|---|---|---|---|
| 2024 | $3,424 | $143,540 | -- | -- |
| 2023 | $3,275 | $139,360 | $0 | $0 |
| 2022 | $3,105 | $135,310 | $0 | $0 |
| 2021 | $3,054 | $131,370 | $0 | $0 |
| 2020 | $2,767 | $127,550 | $0 | $0 |
| 2019 | $2,762 | $123,840 | $0 | $0 |
| 2018 | $2,596 | $120,240 | $0 | $0 |
| 2017 | $2,501 | $116,740 | $0 | $0 |
| 2016 | $2,435 | $113,340 | $0 | $0 |
| 2015 | $2,369 | $110,040 | $0 | $0 |
| 2014 | $2,171 | $106,840 | $0 | $0 |
Source: Public Records
Map
Nearby Homes
- 2220 SE 143rd Ave
- 2150 SE 141st Ave
- 2544 SE 141st Ave
- 2251 SE 139th Ave
- 2701 SE 141st Ave
- 2710 SE 141st Ave Unit 10
- 13943 SE Lincoln St Unit A
- 2700 SE 138th Ave Unit 6
- 2700 SE 138th Ave Unit 4
- 1916 SE 143rd Ave
- 14202 SE Woodward St
- 2730 SE 138th Ave Unit 93
- 13718 SE Division St
- 1936 SE 139th Ave
- 2704 SE 138th Ave Unit 24
- 2712 SE 138th Ave Unit 53
- 2821 SE 145th Ave
- 14605 SE Harrison St
- 14124 SE Mill St
- 2560 SE 136th Ave Unit 2566
- 2250 SE 142nd Ave
- 2238 SE 142nd Ave
- 2226 SE 142nd Ave
- 2302 SE 142nd Ave
- 14238 SE Grant Ct
- 14238 SE Grant Ct
- 2306 SE 142nd Ave
- 14244 SE Grant Ct
- 14255 SE Sherman Ct
- 2233 SE 143rd Ave
- 2314 SE 142nd Ave
- 2247 SE 142nd Ave
- 2253 SE 142nd Ave
- 2217 SE 143rd Ave
- 2231 SE 142nd Ave
- 2338 SE 142nd Ave
- 14267 SE Sherman Ct
- 2285 SE 143rd Ave
- 2309 SE 142nd Ave
- 2245 SE 143rd Ave