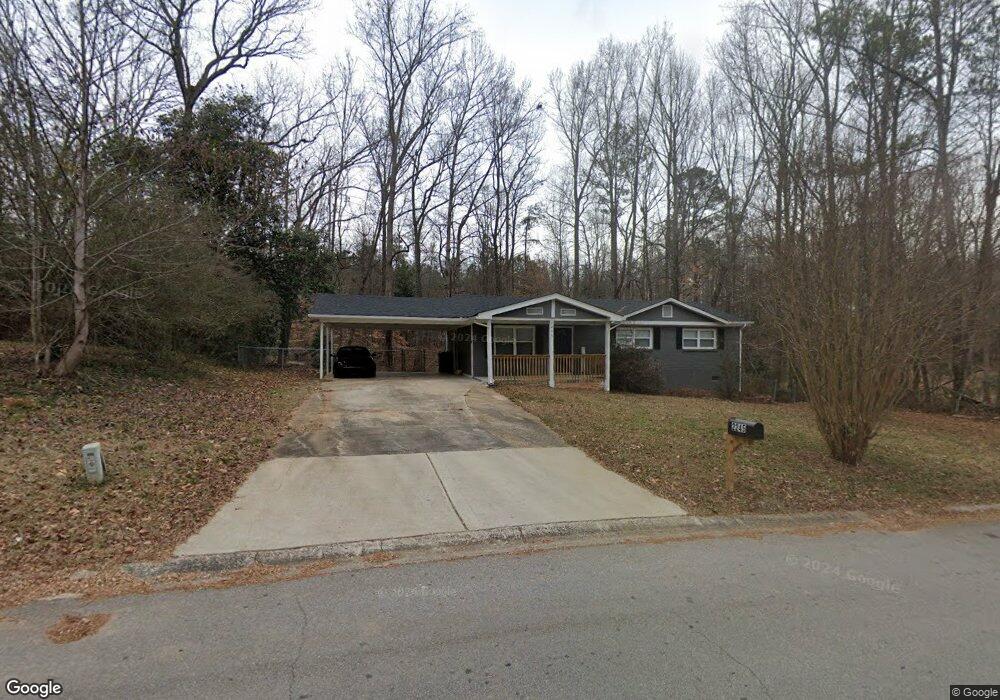
2245 Chestnut Log Loop Lithia Springs, GA 30122
Lithia Springs NeighborhoodEstimated Value: $185,000 - $208,000
3
Beds
2
Baths
1,100
Sq Ft
$181/Sq Ft
Est. Value
About This Home
This home is located at 2245 Chestnut Log Loop, Lithia Springs, GA 30122 and is currently estimated at $199,095, approximately $180 per square foot. 2245 Chestnut Log Loop is a home located in Douglas County with nearby schools including Sweetwater Elementary School, Factory Shoals Middle School, and Lithia Springs Comprehensive High School.
Ownership History
Date
Name
Owned For
Owner Type
Purchase Details
Closed on
Jun 24, 2021
Sold by
Properties West Llc
Bought by
Rs Rental I Llc
Current Estimated Value
Purchase Details
Closed on
Sep 24, 2010
Sold by
Real Property Mgmt Group Inc
Bought by
Properties West Llc
Purchase Details
Closed on
Dec 1, 2009
Sold by
Wells Fargo Bk Na
Bought by
Hud-Housing Of Urban Dev
Purchase Details
Closed on
Apr 1, 2003
Sold by
Blankenship Johnny L
Bought by
Larios Rubelin B
Home Financials for this Owner
Home Financials are based on the most recent Mortgage that was taken out on this home.
Original Mortgage
$96,000
Interest Rate
5.62%
Mortgage Type
FHA
Purchase Details
Closed on
Dec 20, 2002
Sold by
Ellis Alton R and Ellis Deborah L
Bought by
Blankenship Johnny L
Home Financials for this Owner
Home Financials are based on the most recent Mortgage that was taken out on this home.
Original Mortgage
$80,000
Interest Rate
5.89%
Mortgage Type
New Conventional
Create a Home Valuation Report for This Property
The Home Valuation Report is an in-depth analysis detailing your home's value as well as a comparison with similar homes in the area
Home Values in the Area
Average Home Value in this Area
Purchase History
| Date | Buyer | Sale Price | Title Company |
|---|---|---|---|
| Rs Rental I Llc | $340,000 | -- | |
| Properties West Llc | $59,900 | -- | |
| Hud-Housing Of Urban Dev | -- | -- | |
| Wells Fargo Bk Na | $97,352 | -- | |
| Larios Rubelin B | $98,000 | -- | |
| Blankenship Johnny L | $80,000 | -- |
Source: Public Records
Mortgage History
| Date | Status | Borrower | Loan Amount |
|---|---|---|---|
| Previous Owner | Larios Rubelin B | $96,000 | |
| Previous Owner | Blankenship Johnny L | $80,000 |
Source: Public Records
Tax History Compared to Growth
Tax History
| Year | Tax Paid | Tax Assessment Tax Assessment Total Assessment is a certain percentage of the fair market value that is determined by local assessors to be the total taxable value of land and additions on the property. | Land | Improvement |
|---|---|---|---|---|
| 2024 | $1,980 | $62,920 | $18,247 | $44,673 |
| 2023 | $2,001 | $62,920 | $18,247 | $44,673 |
| 2022 | $1,741 | $62,920 | $18,000 | $44,920 |
| 2021 | $1,185 | $36,320 | $12,000 | $24,320 |
| 2019 | $852 | $27,520 | $9,240 | $18,280 |
| 2018 | $723 | $23,240 | $8,040 | $15,200 |
| 2017 | $680 | $21,440 | $8,040 | $13,400 |
| 2016 | $803 | $24,880 | $9,600 | $15,280 |
| 2015 | $713 | $21,640 | $8,520 | $13,120 |
| 2014 | $693 | $20,636 | $8,640 | $11,996 |
| 2013 | -- | $22,680 | $9,600 | $13,080 |
Source: Public Records
Map
Nearby Homes
- 2275 Chestnut Log Loop
- 2322 Chestnut Log Loop
- 2087 Chestnut Way
- 1940 Lee
- 2499 Chestnut Log Loop
- 1815 Lee Rd
- 2182 Ann Ln
- 3570 Briar Dr
- 2344 Mount Vernon Rd
- 8684 Hickory Ln
- LOT 27 Chestnut Ln
- 2436 Falls River Dr
- 3646 Briar Dr
- 3652 Sweetbriar Cir
- 3686 Sweetbriar Cir
- 3460 Meadowview Dr
- 3790 Sweetbriar Cir
- HAYDEN Plan at Fairhaven
- GREEN Plan at Fairhaven
- CALI Plan at Fairhaven
- 2229 Chestnut Log Loop
- 2238 Chestnut Log Loop Unit 4
- 2263 Chestnut Log Loop
- 2252 Chestnut Log Loop
- 2222 Chestnut Log Loop
- 2203 Chestnut Log Way
- 2271 Chestnut Log Loop Unit 5
- 2262 Chestnut Log Loop
- 2195 Chestnut Log Way
- 2202 Chestnut Log Loop
- 2268 Chestnut Log Loop
- 2190 Chestnut Log Way
- 2281 Chestnut Log Loop
- 2192 Chestnut Log Loop
- 2185 Chestnut Log Way Unit 5
- 2274 Chestnut Log Loop
- 2217 Chestnut Log Loop
- 2305 Chestnut Log Place
- 2310 Chestnut Log Place
- 2213 Chestnut Log Loop Unit 4