Estimated Value: $254,197 - $273,000
Studio
--
Bath
1,228
Sq Ft
$217/Sq Ft
Est. Value
About This Home
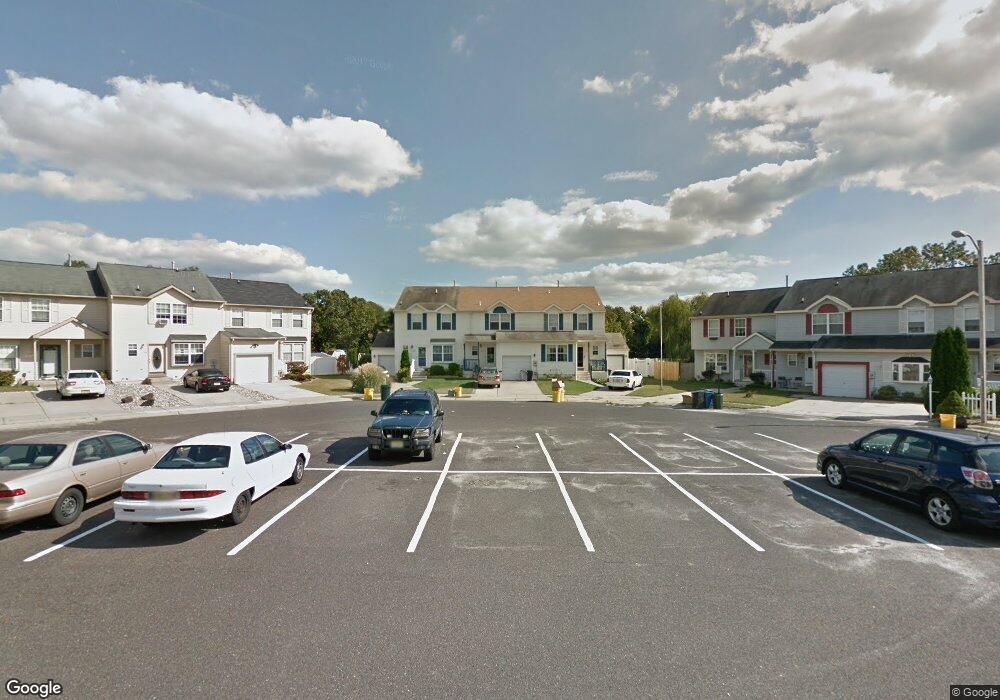
This home is located at 2245 Leon Ct, Atco, NJ 08004 and is currently estimated at $266,049, approximately $216 per square foot. 2245 Leon Ct is a home located in Camden County with nearby schools including Thomas Richards Elementary School, Waterford Elementary School, and Atco Elementary School.
Ownership History
Date
Name
Owned For
Owner Type
Purchase Details
Closed on
Nov 16, 2021
Sold by
Omalley Eva M
Bought by
Omalley Jennifer A
Current Estimated Value
Home Financials for this Owner
Home Financials are based on the most recent Mortgage that was taken out on this home.
Original Mortgage
$140,250
Interest Rate
3.55%
Mortgage Type
New Conventional
Purchase Details
Closed on
Jun 25, 2003
Sold by
Wineburg Paula M
Bought by
O'Malley Dennis M and O'Malley Eva M
Home Financials for this Owner
Home Financials are based on the most recent Mortgage that was taken out on this home.
Original Mortgage
$115,805
Interest Rate
5.27%
Purchase Details
Closed on
Dec 2, 1996
Sold by
Waterbridge Construction Llc
Bought by
Wineburg Steven J
Home Financials for this Owner
Home Financials are based on the most recent Mortgage that was taken out on this home.
Original Mortgage
$85,000
Interest Rate
7.62%
Mortgage Type
FHA
Create a Home Valuation Report for This Property
The Home Valuation Report is an in-depth analysis detailing your home's value as well as a comparison with similar homes in the area
Home Values in the Area
Average Home Value in this Area
Purchase History
| Date | Buyer | Sale Price | Title Company |
|---|---|---|---|
| Omalley Jennifer A | $165,000 | First American Title | |
| O'Malley Dennis M | $121,900 | -- | |
| Wineburg Steven J | $84,980 | -- |
Source: Public Records
Mortgage History
| Date | Status | Borrower | Loan Amount |
|---|---|---|---|
| Previous Owner | Omalley Jennifer A | $140,250 | |
| Previous Owner | O'Malley Dennis M | $115,805 | |
| Previous Owner | Wineburg Steven J | $85,000 |
Source: Public Records
Tax History
| Year | Tax Paid | Tax Assessment Tax Assessment Total Assessment is a certain percentage of the fair market value that is determined by local assessors to be the total taxable value of land and additions on the property. | Land | Improvement |
|---|---|---|---|---|
| 2025 | $5,089 | $115,500 | $23,000 | $92,500 |
| 2024 | $4,963 | $115,500 | $23,000 | $92,500 |
Source: Public Records
Map
Nearby Homes
- 2297 Memorial Ct
- 295 White Horse Pike
- 2480 Gerald Ct
- 326 White Horse Pike
- 275 White Horse Pike
- 2107 Cooper Rd
- 35 Colgate Ct
- 2317 Cooper Rd
- 2307 Cooper Rd
- 22 Josie Ln
- 344 Raritan Ave
- 2157 Almira Ave
- 196 White Horse Pike
- 411 Atco Ave
- 353 Gardens Ave
- 15 Harvard Rd
- 21 Briarcliff Rd
- 181 White Horse Pike
- 470 Waterfords Edge Ct
- 2172 Atco Ave