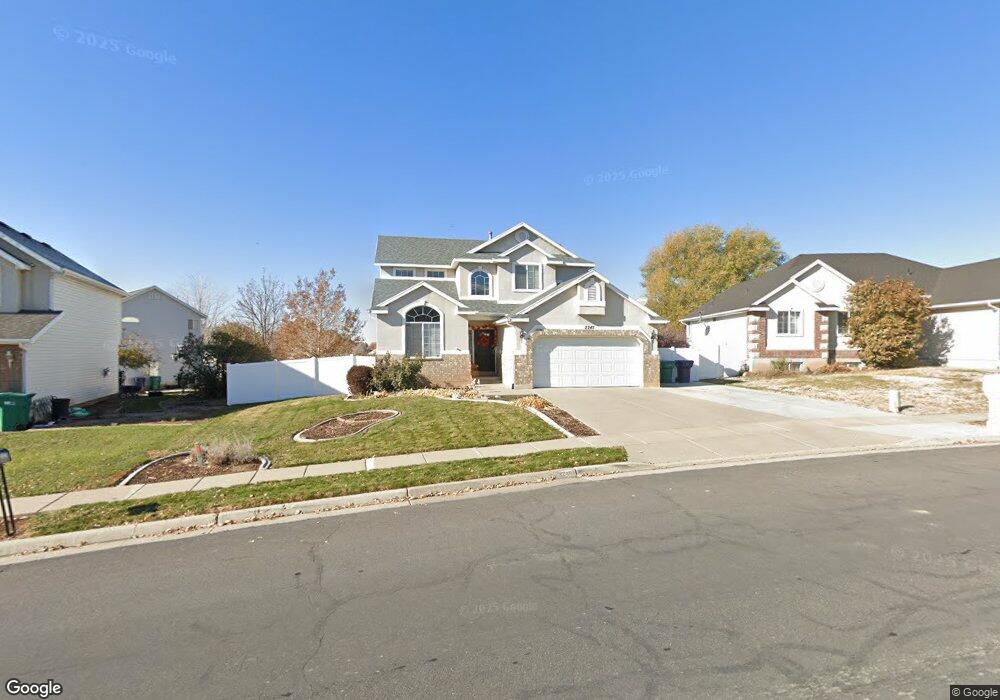
2245 N 800 W Layton, UT 84041
Estimated Value: $543,098 - $579,000
5
Beds
4
Baths
2,671
Sq Ft
$209/Sq Ft
Est. Value
About This Home
This home is located at 2245 N 800 W, Layton, UT 84041 and is currently estimated at $559,025, approximately $209 per square foot. 2245 N 800 W is a home located in Davis County with nearby schools including Lincoln Elementary School, North Layton Junior High School, and Northridge High School.
Ownership History
Date
Name
Owned For
Owner Type
Purchase Details
Closed on
Aug 28, 2008
Sold by
Dienhart Mark A and Dienhart Melodie A
Bought by
Skaggs Richard F and Skaggs Nancy
Current Estimated Value
Purchase Details
Closed on
Dec 15, 2005
Sold by
Ponce Derek E and Ponce Alma
Bought by
Dienhart Mark A and Dienhart Melodie A
Home Financials for this Owner
Home Financials are based on the most recent Mortgage that was taken out on this home.
Original Mortgage
$41,980
Interest Rate
5.88%
Mortgage Type
Unknown
Purchase Details
Closed on
Jul 6, 1998
Sold by
Ponce Derek E
Bought by
Ponce Derek E and Ponce Alma
Home Financials for this Owner
Home Financials are based on the most recent Mortgage that was taken out on this home.
Original Mortgage
$177,100
Interest Rate
7.06%
Mortgage Type
VA
Create a Home Valuation Report for This Property
The Home Valuation Report is an in-depth analysis detailing your home's value as well as a comparison with similar homes in the area
Home Values in the Area
Average Home Value in this Area
Purchase History
| Date | Buyer | Sale Price | Title Company |
|---|---|---|---|
| Skaggs Richard F | -- | Mountain View Title & Escrow | |
| Dienhart Mark A | -- | First American Title | |
| Ponce Derek E | -- | Bonneville Title Company Inc | |
| Ponce Derek E | -- | Bonneville Title Company Inc |
Source: Public Records
Mortgage History
| Date | Status | Borrower | Loan Amount |
|---|---|---|---|
| Previous Owner | Dienhart Mark A | $41,980 | |
| Previous Owner | Dienhart Mark A | $167,920 | |
| Previous Owner | Ponce Derek E | $177,100 |
Source: Public Records
Tax History Compared to Growth
Tax History
| Year | Tax Paid | Tax Assessment Tax Assessment Total Assessment is a certain percentage of the fair market value that is determined by local assessors to be the total taxable value of land and additions on the property. | Land | Improvement |
|---|---|---|---|---|
| 2025 | $2,547 | $267,300 | $101,632 | $165,668 |
| 2024 | $2,424 | $256,299 | $118,444 | $137,855 |
| 2023 | $2,506 | $256,850 | $77,564 | $179,285 |
| 2022 | $2,576 | $474,000 | $135,454 | $338,546 |
| 2021 | $2,358 | $356,000 | $104,334 | $251,666 |
| 2020 | $2,141 | $310,000 | $87,860 | $222,140 |
| 2019 | $2,059 | $292,000 | $83,511 | $208,489 |
| 2018 | $1,896 | $270,000 | $83,511 | $186,489 |
| 2016 | $1,839 | $135,080 | $26,635 | $108,445 |
| 2015 | $1,884 | $131,395 | $26,635 | $104,760 |
| 2014 | $1,934 | $137,891 | $26,635 | $111,256 |
| 2013 | -- | $130,164 | $26,884 | $103,280 |
Source: Public Records
Map
Nearby Homes
- 2149 N 750 W
- 2298 N 1085 W
- 2211 N 525 W
- 1155 W 2200 N
- 2248 N 500 W
- 506 W 2200 N
- 2233 N 475 W
- 538 W 1875 N
- 2875 N Hill Field Rd Unit 17
- 2875 N Hill Field Rd Unit 199
- 2875 N Hill Field Rd Unit 58
- 2875 N Hill Field Rd Unit 62
- 2875 N Hill Field Rd Unit 40
- 398 Paul Ave
- 2887 N 1175 W
- 1094 N Angel St W
- 1036 N Angel St W
- 2053 Evans Cove Loop Unit 39
- 1715 N Alder St
- 709 W Highway 193