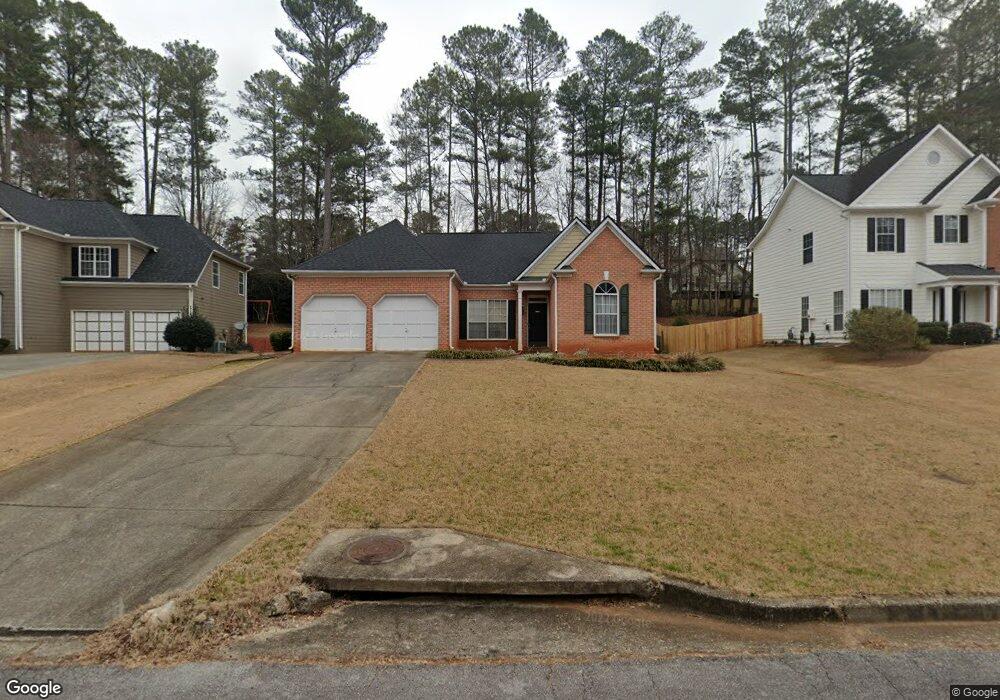
2245 Pendleton Place Suwanee, GA 30024
Estimated Value: $361,658 - $423,000
3
Beds
2
Baths
1,647
Sq Ft
$236/Sq Ft
Est. Value
About This Home
This home is located at 2245 Pendleton Place, Suwanee, GA 30024 and is currently estimated at $389,165, approximately $236 per square foot. 2245 Pendleton Place is a home located in Gwinnett County with nearby schools including Walnut Grove Elementary School, Creekland Middle School, and Collins Hill High School.
Ownership History
Date
Name
Owned For
Owner Type
Purchase Details
Closed on
Mar 31, 2009
Sold by
Refka Erika M
Bought by
Wilson Imani
Current Estimated Value
Home Financials for this Owner
Home Financials are based on the most recent Mortgage that was taken out on this home.
Original Mortgage
$185,576
Outstanding Balance
$117,306
Interest Rate
5.1%
Mortgage Type
FHA
Estimated Equity
$271,859
Purchase Details
Closed on
May 11, 2007
Sold by
Swaney Diane E
Bought by
Refka Erika M
Home Financials for this Owner
Home Financials are based on the most recent Mortgage that was taken out on this home.
Original Mortgage
$148,000
Interest Rate
6.11%
Mortgage Type
New Conventional
Purchase Details
Closed on
Jan 18, 2000
Sold by
Klinect Daniel E
Bought by
Klinect Diane
Purchase Details
Closed on
Feb 29, 1996
Sold by
Mccar Dev Corp
Bought by
Klinect Daniel E Diane S
Create a Home Valuation Report for This Property
The Home Valuation Report is an in-depth analysis detailing your home's value as well as a comparison with similar homes in the area
Home Values in the Area
Average Home Value in this Area
Purchase History
| Date | Buyer | Sale Price | Title Company |
|---|---|---|---|
| Wilson Imani | $189,000 | -- | |
| Refka Erika M | $185,000 | -- | |
| Klinect Diane | -- | -- | |
| Klinect Daniel E Diane S | $125,500 | -- |
Source: Public Records
Mortgage History
| Date | Status | Borrower | Loan Amount |
|---|---|---|---|
| Open | Wilson Imani | $185,576 | |
| Previous Owner | Refka Erika M | $148,000 | |
| Closed | Klinect Daniel E Diane S | $0 |
Source: Public Records
Tax History
| Year | Tax Paid | Tax Assessment Tax Assessment Total Assessment is a certain percentage of the fair market value that is determined by local assessors to be the total taxable value of land and additions on the property. | Land | Improvement |
|---|---|---|---|---|
| 2025 | $3,614 | $131,520 | $28,000 | $103,520 |
| 2024 | $3,690 | $129,200 | $34,000 | $95,200 |
| 2023 | $3,690 | $129,200 | $34,000 | $95,200 |
| 2022 | $3,472 | $120,480 | $32,800 | $87,680 |
| 2021 | $2,930 | $92,200 | $21,400 | $70,800 |
| 2020 | $2,835 | $86,840 | $21,400 | $65,440 |
| 2019 | $2,762 | $86,840 | $21,400 | $65,440 |
| 2018 | $2,446 | $72,280 | $19,600 | $52,680 |
| 2016 | $2,470 | $72,280 | $19,600 | $52,680 |
| 2015 | $2,186 | $58,360 | $14,000 | $44,360 |
| 2014 | -- | $58,360 | $14,000 | $44,360 |
Source: Public Records
Map
Nearby Homes
- 2067 York River Way
- 2105 Laurel Lake Dr
- 2124 York River Way Unit 1
- 401 Hambridge Ct
- 1971 Fernwood Dr
- 2165 Wildwood Lake Dr
- 1811 Chantilly Ct
- 310 Allatoona Rd
- 83 Russell Rd
- 231 Hambridge Ct Unit 1
- 479 Hearth Place
- 2164 Cape Liberty Dr
- 1811 Penny Ln NW
- 81 Russell Rd
- 2285 Wildwood Lake Dr
- 1985 Tyler Trace
- 45 Russell Rd
- 30 Karen Camile Dr
- 2001 Stone Forest Dr
- 345 Deerwood Dr
- 2235 Pendleton Place
- 2255 Pendleton Place
- 2225 Pendleton Place Unit 2
- 1922 Riverton Dr
- 2265 Pendleton Place
- 1902 Riverton Dr Unit 1
- 1902 Riverton Dr
- 2230 Pendleton Place NW Unit 14
- 2215 Pendleton Place
- 1942 Riverton Dr
- 2275 Pendleton Place Unit 2275
- 2275 Pendleton Place
- 2275 Pendleton Place Unit 2
- 2240 Pendleton Place
- 2230 Pendleton Place Unit 14
- 2230 Pendleton Place Unit 2
- 2250 Pendleton Place
- 1892 Riverton Dr
- 2220 Pendleton Place Unit 2
- 2270 Pendleton Place
Your Personal Tour Guide
Ask me questions while you tour the home.