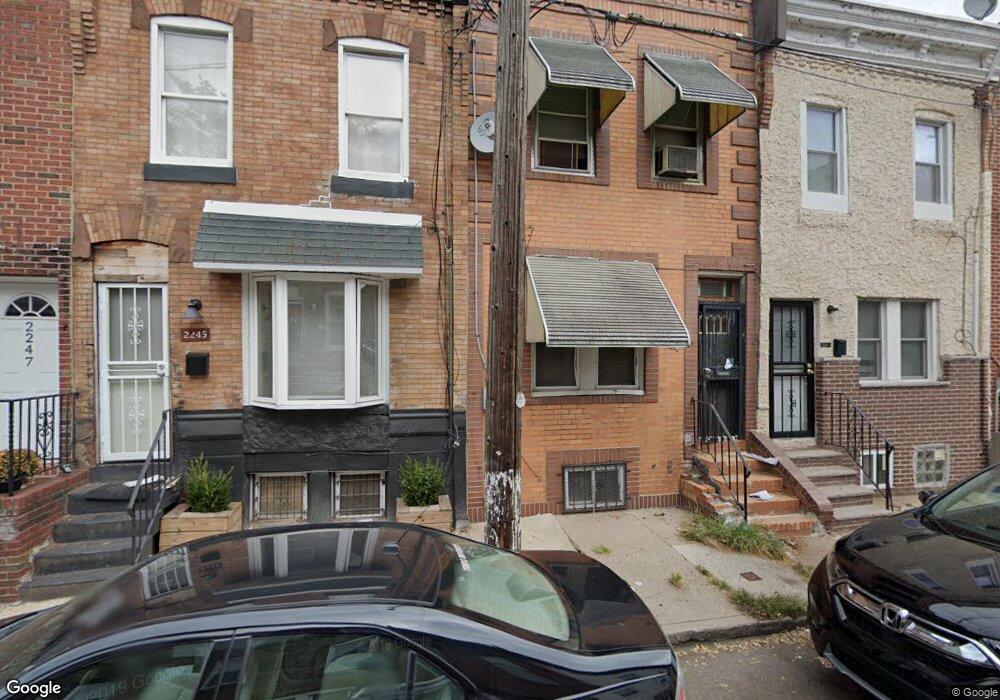
2245 Sigel St Unit A Philadelphia, PA 19145
South Philadelphia West NeighborhoodEstimated Value: $166,000 - $229,000
2
Beds
2
Baths
1,062
Sq Ft
$186/Sq Ft
Est. Value
About This Home
This home is located at 2245 Sigel St Unit A, Philadelphia, PA 19145 and is currently estimated at $197,704, approximately $186 per square foot. 2245 Sigel St Unit A is a home located in Philadelphia County with nearby schools including South Philadelphia High School, Delaplaine McDaniel School, and Universal Vare Charter School.
Ownership History
Date
Name
Owned For
Owner Type
Purchase Details
Closed on
May 28, 2024
Sold by
Ieo Group Llc
Bought by
Armstrong Dejon
Current Estimated Value
Home Financials for this Owner
Home Financials are based on the most recent Mortgage that was taken out on this home.
Original Mortgage
$193,903
Outstanding Balance
$191,499
Interest Rate
7.17%
Mortgage Type
New Conventional
Estimated Equity
$6,205
Purchase Details
Closed on
Dec 23, 2014
Sold by
Group Investments Llc
Bought by
Ieo Group Llc
Purchase Details
Closed on
Sep 19, 2011
Sold by
Metzler Mayan
Bought by
Group Investments Llc
Purchase Details
Closed on
Aug 15, 2005
Sold by
Unknown Heirs Under Gladys Morris
Bought by
The Bank Of New York and Eqcc Asset Backed Certificates Series 20
Purchase Details
Closed on
Aug 10, 2005
Sold by
The Bank Of New York
Bought by
Metzler Mayan
Create a Home Valuation Report for This Property
The Home Valuation Report is an in-depth analysis detailing your home's value as well as a comparison with similar homes in the area
Home Values in the Area
Average Home Value in this Area
Purchase History
| Date | Buyer | Sale Price | Title Company |
|---|---|---|---|
| Armstrong Dejon | $199,900 | None Listed On Document | |
| Ieo Group Llc | $21,500 | Springfield Abstract Inc | |
| Group Investments Llc | $26,544 | None Available | |
| The Bank Of New York | $15,000 | None Available | |
| Metzler Mayan | $28,000 | None Available | |
| Metzler Mayan | $28,000 | None Available |
Source: Public Records
Mortgage History
| Date | Status | Borrower | Loan Amount |
|---|---|---|---|
| Open | Armstrong Dejon | $193,903 |
Source: Public Records
Tax History Compared to Growth
Tax History
| Year | Tax Paid | Tax Assessment Tax Assessment Total Assessment is a certain percentage of the fair market value that is determined by local assessors to be the total taxable value of land and additions on the property. | Land | Improvement |
|---|---|---|---|---|
| 2025 | $1,914 | $176,800 | $35,360 | $141,440 |
| 2024 | $1,914 | $176,800 | $35,360 | $141,440 |
| 2023 | $1,914 | $136,700 | $27,340 | $109,360 |
| 2022 | $1,264 | $136,700 | $27,340 | $109,360 |
| 2021 | $1,264 | $0 | $0 | $0 |
| 2020 | $1,264 | $0 | $0 | $0 |
| 2019 | $1,176 | $0 | $0 | $0 |
| 2018 | $802 | $0 | $0 | $0 |
| 2017 | $802 | $0 | $0 | $0 |
| 2016 | $802 | $0 | $0 | $0 |
| 2015 | $870 | $0 | $0 | $0 |
| 2014 | -- | $64,900 | $6,633 | $58,267 |
| 2012 | -- | $4,800 | $1,280 | $3,520 |
Source: Public Records
Map
Nearby Homes
- 2237 Mcclellan St
- 1817 S 23rd St
- 2233 Moore St
- 1741 S 23rd St
- 1833 S 22nd St
- 2238 Pierce St
- 1912 S Croskey St
- 2309 Moore St
- 1918 S Croskey St
- 2135 Mifflin St
- 2230 Watkins St
- 2133 Mifflin St
- 2317 Moore St
- 2127 Sigel St
- 2130 Sigel St
- 2320 Moore St
- 2312 Pierce St
- 1914 S 23rd St
- 2323 Moore St
- 2119 Sigel St
- 2245 Sigel St
- 2247 Sigel St
- 2243 Sigel St
- 2241 Sigel St
- 2239 Sigel St
- 1825 S 23rd St
- 1823 S 23rd St
- 2244 Mcclellan St
- 2246 Mcclellan St
- 2242 Mcclellan St
- 2240 Mcclellan St
- 1821 S 23rd St
- 2242 Sigel St
- 2244 Sigel St
- 1819 S 23rd St
- 2235 Sigel St
- 2238 Mcclellan St
- 2246 Sigel St
- 2240 Sigel St
- 2238 Sigel St