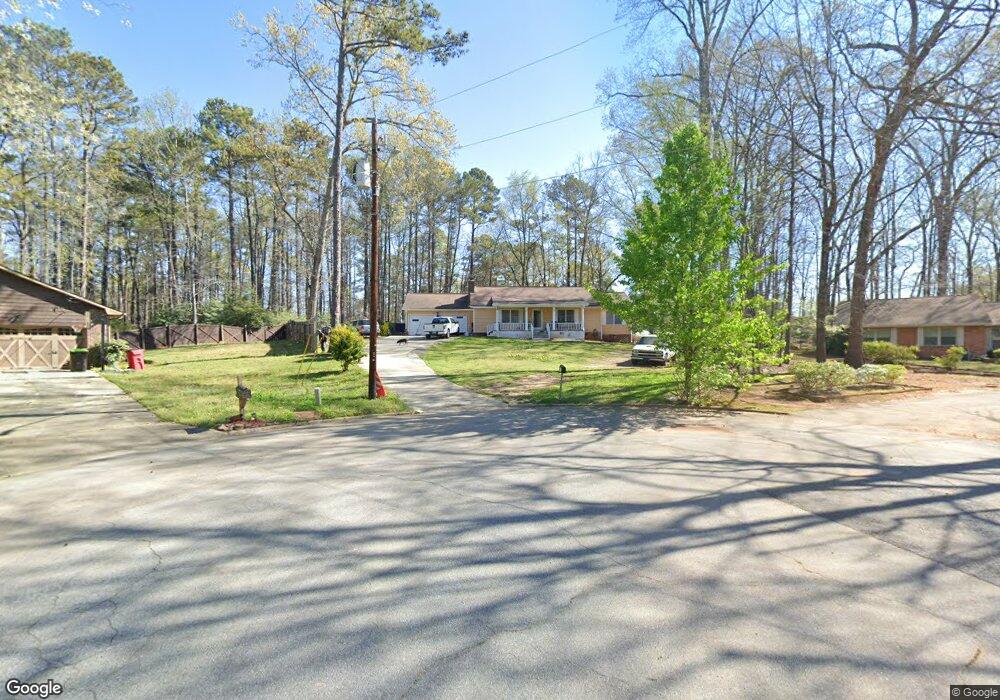
2245 Silverthorn Ct Jonesboro, GA 30236
Estimated Value: $208,000 - $271,000
3
Beds
2
Baths
1,648
Sq Ft
$148/Sq Ft
Est. Value
About This Home
This home is located at 2245 Silverthorn Ct, Jonesboro, GA 30236 and is currently estimated at $243,127, approximately $147 per square foot. 2245 Silverthorn Ct is a home located in Clayton County with nearby schools including James Jackson Elementary School, M. D. Roberts Middle School, and Mount Zion High School.
Ownership History
Date
Name
Owned For
Owner Type
Purchase Details
Closed on
Feb 6, 2009
Sold by
Hud-Housing Of Urban Dev
Bought by
Dixon James and Dixon Robin L
Current Estimated Value
Home Financials for this Owner
Home Financials are based on the most recent Mortgage that was taken out on this home.
Original Mortgage
$101,398
Outstanding Balance
$64,540
Interest Rate
5.23%
Mortgage Type
FHA
Estimated Equity
$178,587
Purchase Details
Closed on
Jun 5, 2007
Sold by
Abn Amro Mortgage Group Inc
Bought by
Hud-Housing Of Urban Dev
Purchase Details
Closed on
May 8, 2002
Sold by
Citibank Na
Bought by
Healy Marvin
Home Financials for this Owner
Home Financials are based on the most recent Mortgage that was taken out on this home.
Original Mortgage
$109,137
Interest Rate
6.98%
Mortgage Type
FHA
Purchase Details
Closed on
Oct 30, 1995
Sold by
Harrington John
Bought by
Sanders Andre Donna
Create a Home Valuation Report for This Property
The Home Valuation Report is an in-depth analysis detailing your home's value as well as a comparison with similar homes in the area
Home Values in the Area
Average Home Value in this Area
Purchase History
| Date | Buyer | Sale Price | Title Company |
|---|---|---|---|
| Dixon James | -- | -- | |
| Hud-Housing Of Urban Dev | -- | -- | |
| Abn Amro Mortgage Group Inc | $130,169 | -- | |
| Healy Marvin | $110,000 | -- | |
| Sanders Andre Donna | $89,000 | -- |
Source: Public Records
Mortgage History
| Date | Status | Borrower | Loan Amount |
|---|---|---|---|
| Open | Dixon James | $101,398 | |
| Previous Owner | Healy Marvin | $109,137 |
Source: Public Records
Tax History Compared to Growth
Tax History
| Year | Tax Paid | Tax Assessment Tax Assessment Total Assessment is a certain percentage of the fair market value that is determined by local assessors to be the total taxable value of land and additions on the property. | Land | Improvement |
|---|---|---|---|---|
| 2024 | $1,649 | $93,160 | $8,000 | $85,160 |
| 2023 | $2,757 | $76,360 | $8,000 | $68,360 |
| 2022 | $1,358 | $78,720 | $8,000 | $70,720 |
| 2021 | $1,452 | $53,960 | $8,000 | $45,960 |
| 2020 | $1,531 | $47,404 | $8,000 | $39,404 |
| 2019 | $1,576 | $47,951 | $8,000 | $39,951 |
| 2018 | $1,402 | $43,672 | $8,000 | $35,672 |
| 2017 | $1,095 | $36,053 | $8,000 | $28,053 |
| 2016 | $1,094 | $36,032 | $8,000 | $28,032 |
| 2015 | $1,092 | $0 | $0 | $0 |
| 2014 | $1,039 | $35,217 | $8,000 | $27,217 |
Source: Public Records
Map
Nearby Homes
- 7942 Rand Rd
- 7940 Rand Rd
- 2238 Danver Ct
- 0 Highway 138 E Unit 10460006
- 0 Highway 138 E Unit 10650191
- 0 Highway 138 E Unit 10638505
- 2115 Logan Dr
- 2140 Indian Hill Rd
- 2084 Jadestone Ct
- 2254 Lisbon Ln
- 7583 Sunstone Dr
- 7519 Conkle Rd Unit 2
- 1904 Cades Cove
- 1938 Wrights Way
- 7972 Woods Ln Unit IX
- 1837 Coventry Way
- 7455 Page Ct
- 7475 Danielle Ct
- 8228 Lullwater Ct
- 7621 Raleigh Ln
- 2244 Silverthorn Ct Unit 1
- 2241 Silverthorn Ct
- 2238 Silverthorn Ct Unit 1
- 2235 Silverthorn Ct
- 7822 Fielder Rd
- 7863 Rand Rd
- 7818 Fielder Rd
- 7828 Rand Rd
- 7844 Rand Rd
- 7814 Fielder Rd
- 7826 Fielder Rd
- 2227 Silverthorn Ct
- 7818 Rand Rd
- 7810 Fielder Rd
- 2218 Silverthorn Ct
- 0 Crane Rd Unit 8459762
- 0 Crane Rd
- 0 Crane Rd Unit 8195596
- 0 Crane Rd Unit 7413117
- 7850 Rand Rd