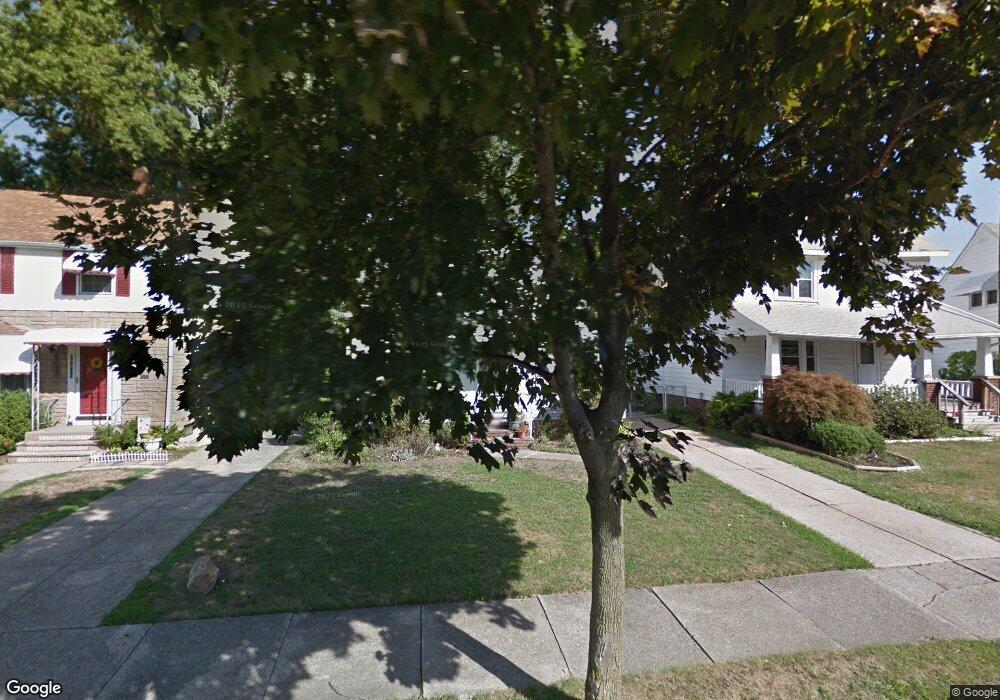
22451 Seabrooke Ave Euclid, OH 44123
Estimated Value: $91,000 - $109,000
4
Beds
1
Bath
1,128
Sq Ft
$89/Sq Ft
Est. Value
About This Home
This home is located at 22451 Seabrooke Ave, Euclid, OH 44123 and is currently estimated at $100,870, approximately $89 per square foot. 22451 Seabrooke Ave is a home located in Cuyahoga County with nearby schools including Arbor Elementary School, Euclid Middle School, and Euclid High School.
Ownership History
Date
Name
Owned For
Owner Type
Purchase Details
Closed on
Sep 22, 2025
Sold by
Leppelmeier Rosemary N
Bought by
Leppelmeier Edward W
Current Estimated Value
Home Financials for this Owner
Home Financials are based on the most recent Mortgage that was taken out on this home.
Original Mortgage
$88,369
Outstanding Balance
$88,291
Interest Rate
6.63%
Mortgage Type
FHA
Estimated Equity
$12,579
Purchase Details
Closed on
Aug 30, 2002
Sold by
Noch Stanley A
Bought by
Leppelmeier Rosemary N
Purchase Details
Closed on
Oct 11, 1995
Sold by
Hess Ralph J
Bought by
Noch Stanley A and Noch Josephine C
Home Financials for this Owner
Home Financials are based on the most recent Mortgage that was taken out on this home.
Original Mortgage
$49,000
Interest Rate
7.88%
Mortgage Type
New Conventional
Purchase Details
Closed on
Mar 31, 1988
Sold by
Kovacs George
Bought by
Hess Ralph J
Purchase Details
Closed on
Mar 11, 1982
Sold by
George Kovacs
Bought by
Kovacs George
Purchase Details
Closed on
Feb 26, 1981
Sold by
Kovacs George and Kovacs Anna
Bought by
George Kovacs
Purchase Details
Closed on
Jan 1, 1975
Bought by
Kovacs George and Kovacs Anna
Create a Home Valuation Report for This Property
The Home Valuation Report is an in-depth analysis detailing your home's value as well as a comparison with similar homes in the area
Home Values in the Area
Average Home Value in this Area
Purchase History
| Date | Buyer | Sale Price | Title Company |
|---|---|---|---|
| Leppelmeier Edward W | $90,000 | Ohio Real Title | |
| Leppelmeier Rosemary N | -- | -- | |
| Noch Stanley A | $70,000 | -- | |
| Hess Ralph J | $45,900 | -- | |
| Kovacs George | -- | -- | |
| George Kovacs | -- | -- | |
| Kovacs George | -- | -- |
Source: Public Records
Mortgage History
| Date | Status | Borrower | Loan Amount |
|---|---|---|---|
| Open | Leppelmeier Edward W | $88,369 | |
| Previous Owner | Noch Stanley A | $49,000 |
Source: Public Records
Tax History Compared to Growth
Tax History
| Year | Tax Paid | Tax Assessment Tax Assessment Total Assessment is a certain percentage of the fair market value that is determined by local assessors to be the total taxable value of land and additions on the property. | Land | Improvement |
|---|---|---|---|---|
| 2024 | $1,756 | $34,160 | $7,035 | $27,125 |
| 2023 | $1,655 | $27,440 | $5,110 | $22,330 |
| 2022 | $1,652 | $27,440 | $5,110 | $22,330 |
| 2021 | $1,833 | $27,440 | $5,110 | $22,330 |
| 2020 | $1,796 | $25,410 | $4,730 | $20,690 |
| 2019 | $1,612 | $72,600 | $13,500 | $59,100 |
| 2018 | $1,173 | $25,410 | $4,730 | $20,690 |
| 2017 | $1,706 | $23,380 | $4,620 | $18,760 |
| 2016 | $1,710 | $23,380 | $4,620 | $18,760 |
| 2015 | $2,409 | $23,380 | $4,620 | $18,760 |
| 2014 | $2,409 | $23,380 | $4,620 | $18,760 |
Source: Public Records
Map
Nearby Homes
- 441 Kenwood Dr Unit M
- 461 Kenwood Dr Unit T3
- 450 Kenwood Dr Unit E12
- 470 Kenwood Dr Unit D
- 430 Kenwood Dr Unit C11
- 421 Kenwood Dr Unit G
- 490 Kenwood Dr Unit B
- 22000 Kennison Ave
- 22751 Fox Ave
- 521 Kenwood Dr Unit A5
- 226 E 216th St
- 290 E 216th St
- 23198 Gay St
- 22301 Milton Dr
- 21561 Maydale Ave
- 254 E 214th St
- 104 E 216th St
- 174 E 212th St
- 23307 Williams Ave
- 231 E 210th St
- 22435 Seabrooke Ave
- 22501 Seabrooke Ave
- 22425 Seabrooke Ave
- 22531 Seabrooke Ave
- 22401 Seabrooke Ave
- 22551 Seabrooke Ave
- 2982 Trueman
- 22450 Seabrooke Ave
- 22434 Seabrooke Ave
- 22470 Seabrooke Ave
- 22420 Seabrooke Ave
- 22400 Seabrooke Ave
- 22571 Seabrooke Ave
- 22600 Seabrooke Ave
- 335 E 222nd St
- 22350 Seabrooke Ave
- 341 E 222nd St
- 22591 Seabrooke Ave
- 22300 Seabrooke Ave
- 22451 Lakemont Ave