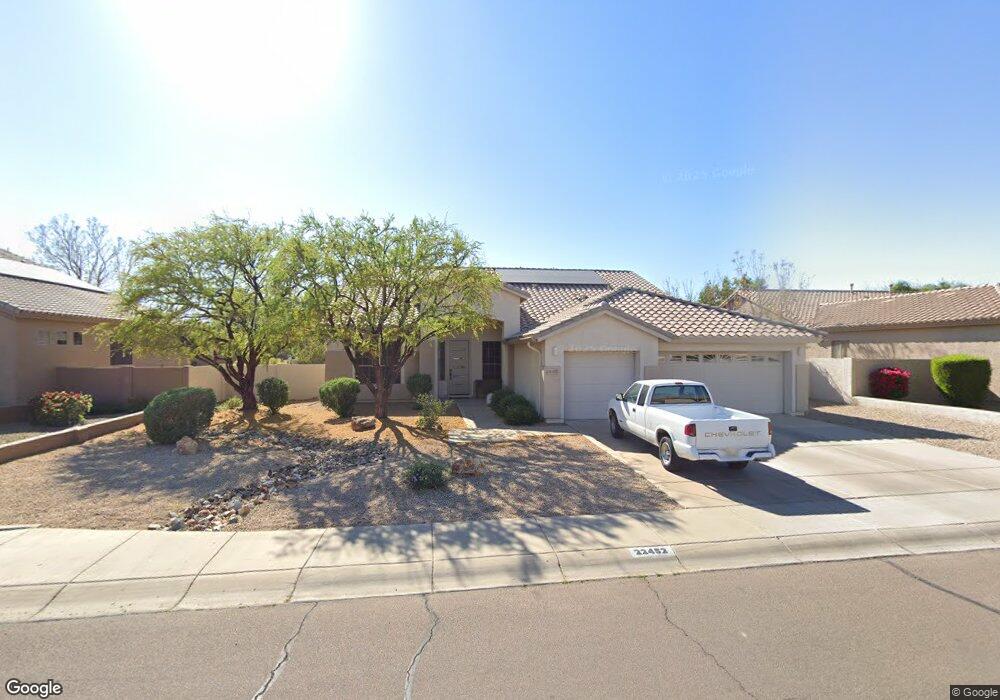
22452 N 80th Ln Peoria, AZ 85383
Estimated Value: $634,237 - $782,000
--
Bed
4
Baths
2,705
Sq Ft
$270/Sq Ft
Est. Value
About This Home
This home is located at 22452 N 80th Ln, Peoria, AZ 85383 and is currently estimated at $730,559, approximately $270 per square foot. 22452 N 80th Ln is a home located in Maricopa County with nearby schools including Frontier Elementary School, Sunrise Mountain High School, and Legacy Traditional School - Peoria.
Ownership History
Date
Name
Owned For
Owner Type
Purchase Details
Closed on
Nov 15, 2006
Sold by
Cook Frank M and Cook Mary M
Bought by
Cook Frank M and Cook Mary M
Current Estimated Value
Purchase Details
Closed on
Aug 25, 2005
Sold by
Haire Faith
Bought by
Haire Branden
Purchase Details
Closed on
Aug 4, 2005
Sold by
Cheshier Donald
Bought by
Cheshier Cathy
Purchase Details
Closed on
May 24, 2000
Sold by
Engle Homes/Arizona Inc
Bought by
Cook Frank M and Cook Mary M
Home Financials for this Owner
Home Financials are based on the most recent Mortgage that was taken out on this home.
Original Mortgage
$175,750
Outstanding Balance
$60,454
Interest Rate
8.08%
Mortgage Type
New Conventional
Estimated Equity
$670,105
Purchase Details
Closed on
Feb 27, 1998
Sold by
Watson Randy R and Watson Jennifer J
Bought by
Ocwen Federal Bank Fsb
Create a Home Valuation Report for This Property
The Home Valuation Report is an in-depth analysis detailing your home's value as well as a comparison with similar homes in the area
Home Values in the Area
Average Home Value in this Area
Purchase History
| Date | Buyer | Sale Price | Title Company |
|---|---|---|---|
| Cook Frank M | -- | None Available | |
| Haire Branden | -- | Lawyers Title Ins | |
| Cheshier Cathy | -- | Lawyers Title Ins | |
| Cook Frank M | $219,732 | First American Title | |
| Ocwen Federal Bank Fsb | -- | Nations Title Insurance |
Source: Public Records
Mortgage History
| Date | Status | Borrower | Loan Amount |
|---|---|---|---|
| Open | Cook Frank M | $175,750 |
Source: Public Records
Tax History Compared to Growth
Tax History
| Year | Tax Paid | Tax Assessment Tax Assessment Total Assessment is a certain percentage of the fair market value that is determined by local assessors to be the total taxable value of land and additions on the property. | Land | Improvement |
|---|---|---|---|---|
| 2025 | $3,054 | $40,205 | -- | -- |
| 2024 | $3,086 | $38,290 | -- | -- |
| 2023 | $3,086 | $48,070 | $9,610 | $38,460 |
| 2022 | $3,019 | $36,630 | $7,320 | $29,310 |
| 2021 | $3,231 | $34,410 | $6,880 | $27,530 |
| 2020 | $3,262 | $32,830 | $6,560 | $26,270 |
| 2019 | $3,156 | $31,450 | $6,290 | $25,160 |
| 2018 | $3,052 | $30,510 | $6,100 | $24,410 |
| 2017 | $3,053 | $27,920 | $5,580 | $22,340 |
| 2016 | $3,023 | $27,420 | $5,480 | $21,940 |
| 2015 | $2,820 | $28,400 | $5,680 | $22,720 |
Source: Public Records
Map
Nearby Homes
- 7965 W Robin Ln
- 8068 W Carlota Ln
- 22471 N 79th Dr
- 22478 N 78th Ln
- 22321 N 79th Dr
- 8209 W Villa Chula Ln
- 7664 W Donald Dr
- 7849 W Vía Del Sol
- 21925 N 78th Dr
- 7813 W Vía Del Sol
- 8024 W Melinda Ln
- 7670 W Sands Dr
- 8425 W Louise Ct
- 22241 N 76th Dr
- 8511 W Via Montoya Dr
- 21527 N 78th Ln
- 23252 N 76th Ln
- 8010 W Adam Ave
- 8621 W Via Montoya Dr
- 21638 N 85th Ave
- 22442 N 80th Ln
- 8034 W Robin Ln
- 22451 N 81st Ave
- 22461 N 81st Ave
- 22432 N 80th Ln
- 22431 N 81st Ave
- 22471 N 81st Ave
- 8033 W Donald Dr
- 8028 W Robin Ln
- 22512 N 80th Ln
- 22422 N 80th Ln
- 8027 W Donald Dr
- 8027 W Robin Ln
- 22421 N 81st Ave
- 22511 N 81st Ave
- 8022 W Robin Ln
- 8034 W Foothill Dr
- 22522 N 80th Ln
- 8021 W Donald Dr
- 8021 W Robin Ln