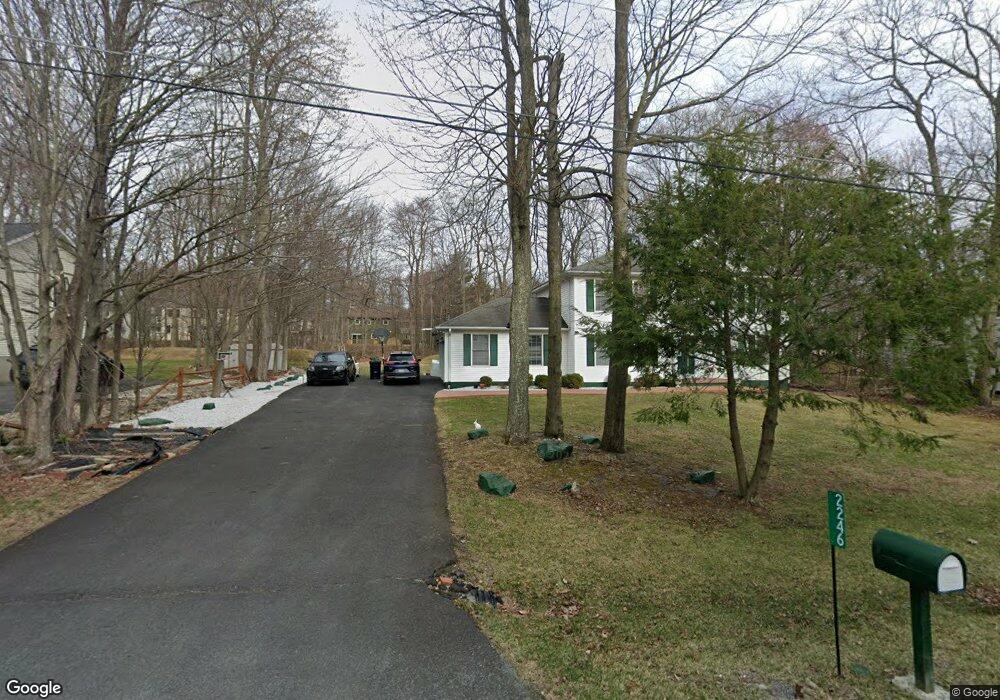
2246 Jester Ct Tobyhanna, PA 18466
Estimated Value: $317,000 - $361,000
3
Beds
4
Baths
2,202
Sq Ft
$157/Sq Ft
Est. Value
About This Home
This home is located at 2246 Jester Ct, Tobyhanna, PA 18466 and is currently estimated at $344,850, approximately $156 per square foot. 2246 Jester Ct is a home located in Monroe County with nearby schools including Clear Run Intermediate School, Pocono Mountain West Junior High School, and Pocono Mountain West High School.
Ownership History
Date
Name
Owned For
Owner Type
Purchase Details
Closed on
Jul 21, 2012
Sold by
Peters Craig and Peters Jennifer A
Bought by
Seenarine Shalini
Current Estimated Value
Home Financials for this Owner
Home Financials are based on the most recent Mortgage that was taken out on this home.
Original Mortgage
$103,785
Outstanding Balance
$71,912
Interest Rate
3.75%
Mortgage Type
FHA
Estimated Equity
$272,938
Purchase Details
Closed on
Nov 17, 2005
Sold by
Albano Paul Henry and Albano Nelissa R
Bought by
Peters Craig and Peters Jennifer A
Home Financials for this Owner
Home Financials are based on the most recent Mortgage that was taken out on this home.
Original Mortgage
$130,000
Interest Rate
6.14%
Mortgage Type
New Conventional
Create a Home Valuation Report for This Property
The Home Valuation Report is an in-depth analysis detailing your home's value as well as a comparison with similar homes in the area
Home Values in the Area
Average Home Value in this Area
Purchase History
| Date | Buyer | Sale Price | Title Company |
|---|---|---|---|
| Seenarine Shalini | $118,000 | None Available | |
| Peters Craig | $218,000 | Keystone Land Abstract North |
Source: Public Records
Mortgage History
| Date | Status | Borrower | Loan Amount |
|---|---|---|---|
| Open | Seenarine Shalini | $103,785 | |
| Previous Owner | Peters Craig | $130,000 |
Source: Public Records
Tax History Compared to Growth
Tax History
| Year | Tax Paid | Tax Assessment Tax Assessment Total Assessment is a certain percentage of the fair market value that is determined by local assessors to be the total taxable value of land and additions on the property. | Land | Improvement |
|---|---|---|---|---|
| 2025 | $1,608 | $161,610 | $25,210 | $136,400 |
| 2024 | $1,346 | $161,610 | $25,210 | $136,400 |
| 2023 | $4,311 | $161,610 | $25,210 | $136,400 |
| 2022 | $4,234 | $161,610 | $25,210 | $136,400 |
| 2021 | $4,234 | $161,610 | $25,210 | $136,400 |
| 2020 | $26,487 | $161,610 | $25,210 | $136,400 |
| 2019 | $6,413 | $37,440 | $5,250 | $32,190 |
| 2018 | $6,413 | $37,440 | $5,250 | $32,190 |
| 2017 | $6,488 | $37,440 | $5,250 | $32,190 |
| 2016 | $1,385 | $37,440 | $5,250 | $32,190 |
| 2015 | $4,889 | $37,440 | $5,250 | $32,190 |
| 2014 | $4,889 | $37,440 | $5,250 | $32,190 |
Source: Public Records
Map
Nearby Homes
- 3109 Robert David Dr
- 6146 Horatio Rd
- 0 Robert David Dr Unit Lot 407
- 2127 Titania Rd
- 2150 Geraci Place
- 4149 Romeo Rd
- 4186 Devon Dr
- 215 Dorset Rd
- 258 Dorset Rd
- 19 Sherman Dr
- 112 Ewe Ln
- 421 Fitzgerald Place
- 339 Route 196
- 15 Sherman Dr
- 1127 Tomasula Dr
- 321 Lr 949
- 326 Coach Rd
- 3209 Evergreen Cir
- 1581 Belgravia Dr
- 135 Fergus Way
- 1008 Jester Ct
- 2242 Jester Ct
- 1006 Jester Ct
- 1007 Jester Ct
- 2164 Titania Rd
- 0 Jester Ct
- 10.98 Acre Jester Ct
- 20 Jester Ct
- 1124 Titania Rd
- 2166 Titania Rd
- 1004 Jester Ct
- 1009 Jester Ct
- 1123 Titania Rd
- 2254 Jester Ct
- 805 Victoria Dr
- 1125 Titania Rd
- 2170 Titania Rd
- 1125 Titania Rd 1125 Rd
- 34 Jester Ct
- 32 Jester Ct