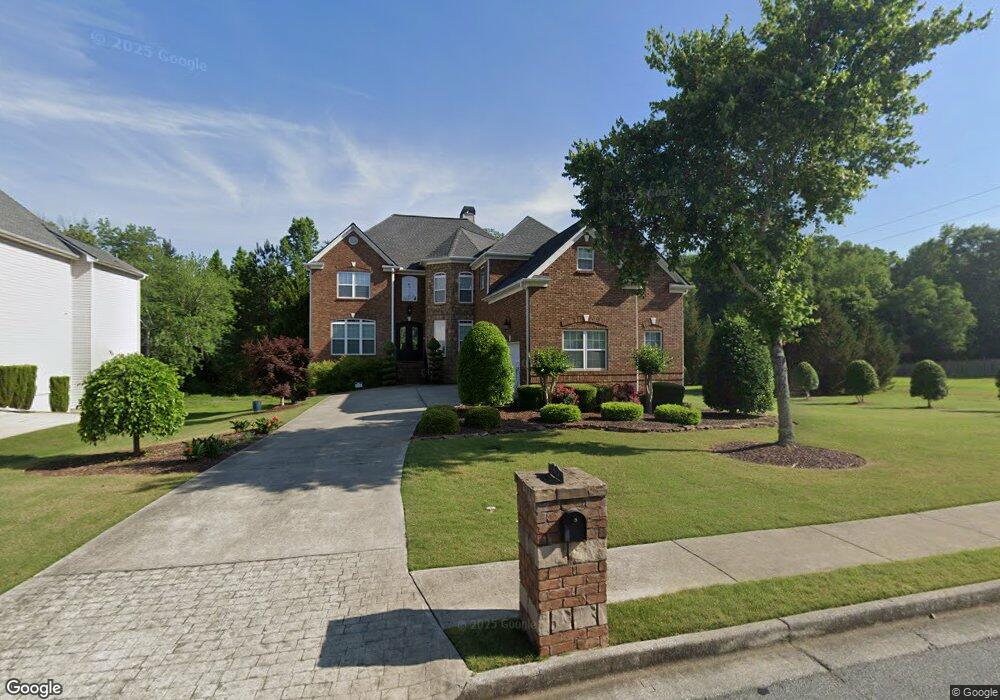
2246 Noelle Place Powder Springs, GA 30127
Estimated Value: $572,297 - $640,000
5
Beds
5
Baths
3,703
Sq Ft
$166/Sq Ft
Est. Value
About This Home
This home is located at 2246 Noelle Place, Powder Springs, GA 30127 and is currently estimated at $615,074, approximately $166 per square foot. 2246 Noelle Place is a home located in Cobb County with nearby schools including Tapp Middle School, McEachern High School, and Grace Baptist Christian School.
Ownership History
Date
Name
Owned For
Owner Type
Purchase Details
Closed on
Apr 10, 2013
Sold by
Boykin Kaye
Bought by
Boykin Kaye and Boykin Jesse E
Current Estimated Value
Purchase Details
Closed on
Feb 27, 2006
Sold by
Hampton Thelma F
Bought by
Hampton Thelma F and Hampton Marion
Purchase Details
Closed on
Jul 22, 2005
Sold by
Wilsons Classic Hms Inc
Bought by
Boykin Kaye
Home Financials for this Owner
Home Financials are based on the most recent Mortgage that was taken out on this home.
Original Mortgage
$333,000
Interest Rate
7.5%
Mortgage Type
New Conventional
Purchase Details
Closed on
Apr 29, 2004
Sold by
Pws Inc
Bought by
Wilsons Classic Homes Inc
Home Financials for this Owner
Home Financials are based on the most recent Mortgage that was taken out on this home.
Original Mortgage
$231,425
Interest Rate
5.49%
Mortgage Type
Stand Alone Second
Create a Home Valuation Report for This Property
The Home Valuation Report is an in-depth analysis detailing your home's value as well as a comparison with similar homes in the area
Home Values in the Area
Average Home Value in this Area
Purchase History
| Date | Buyer | Sale Price | Title Company |
|---|---|---|---|
| Boykin Kaye | $405,929 | -- | |
| Hampton Thelma F | -- | -- | |
| Boykin Kaye | $406,000 | -- | |
| Wilsons Classic Homes Inc | $346,500 | -- |
Source: Public Records
Mortgage History
| Date | Status | Borrower | Loan Amount |
|---|---|---|---|
| Previous Owner | Boykin Kaye | $333,000 | |
| Previous Owner | Wilsons Classic Homes Inc | $231,425 |
Source: Public Records
Tax History Compared to Growth
Tax History
| Year | Tax Paid | Tax Assessment Tax Assessment Total Assessment is a certain percentage of the fair market value that is determined by local assessors to be the total taxable value of land and additions on the property. | Land | Improvement |
|---|---|---|---|---|
| 2025 | $6,374 | $250,960 | $36,000 | $214,960 |
| 2024 | $6,379 | $250,960 | $36,000 | $214,960 |
| 2023 | $4,700 | $198,544 | $36,000 | $162,544 |
| 2022 | $4,236 | $150,852 | $28,000 | $122,852 |
| 2021 | $4,236 | $150,852 | $28,000 | $122,852 |
| 2020 | $3,682 | $130,336 | $28,000 | $102,336 |
| 2019 | $3,682 | $130,336 | $28,000 | $102,336 |
| 2018 | $3,682 | $130,336 | $28,000 | $102,336 |
| 2017 | $3,491 | $130,336 | $28,000 | $102,336 |
| 2016 | $2,626 | $100,232 | $17,200 | $83,032 |
| 2015 | $2,693 | $100,232 | $17,200 | $83,032 |
| 2014 | $2,715 | $100,232 | $0 | $0 |
Source: Public Records
Map
Nearby Homes
- 2239 Noelle Place
- 2223 Noelle Place
- 4821 Overland Dr
- Payton III Plan at Springside Reserve - Farmhouse Series
- Monroe Plan at Springside Reserve - Farmhouse Series
- Huntington Plan at Springside Reserve - Farmhouse Series
- Benjamin II Plan at Springside Reserve - Farmhouse Series
- Richard II Plan at Springside Reserve - Farmhouse Series
- Somerset III Plan at Springside Reserve - Farmhouse Series
- Reynold Plan at Springside Reserve - Farmhouse Series
- Alexander Plan at Springside Reserve - Farmhouse Series
- 4350 Gaydon Rd
- 2532 Greenes Ln
- 4696 Cooling Water Cir
- 2337 Old Lost Mountain Rd
- 4625 Gaydon Rd
- 5199 Olive Branch Cir
- 5110 MacLand Rd
- 2607 Restoration Dr
- 2695 Moon Cabin Dr
- 2250 Noelle Place
- Lot 21 Noelle
- LOT 20 Noelle
- LOT 15 Noelle
- LOT 58 Noelle
- LOT 9 Noelle
- 2254 Noelle Place
- 2247 Noelle Place Unit 1
- 2238 Noelle Place Unit 64
- 2238 Noelle Place
- 2255 Noelle Place Unit 1
- 2258 Noelle Place
- 2239 Noelle Place Unit 64
- 2232 Noelle Place
- 2412 Noelle Ln
- 2114 Noelle Ln
- 4858 Cathedral Ct
- 4858 Cathedral Ct Unit 67
- 2262 Noelle Place
- 2235 Noelle Ln Unit 63