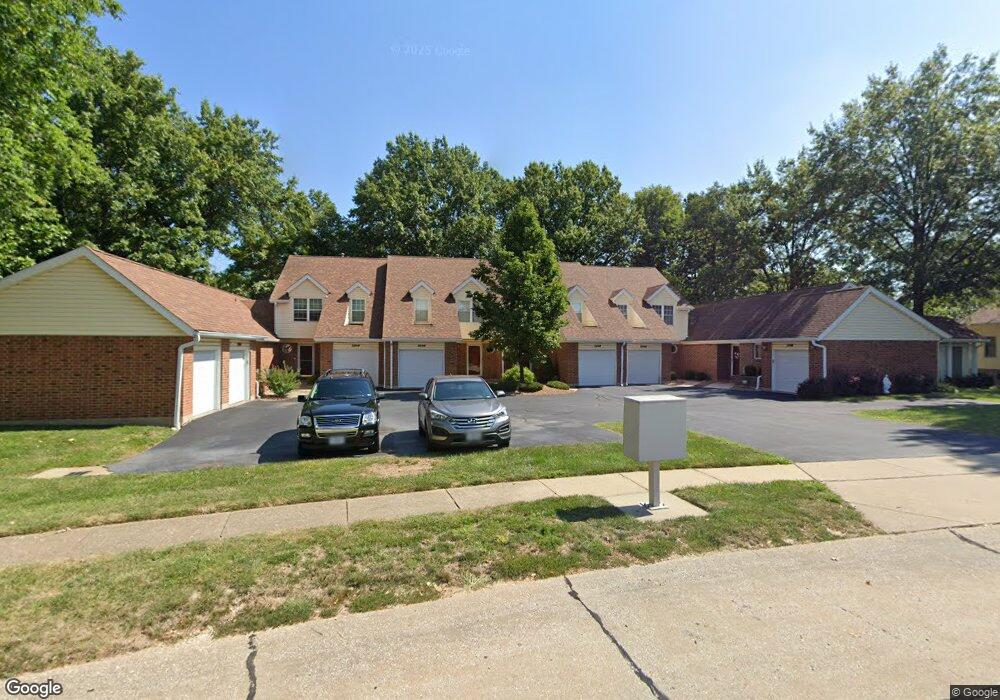
2246 Riverwood Trails Dr Unit 2246 Florissant, MO 63031
Estimated Value: $164,863 - $180,000
2
Beds
2
Baths
1,425
Sq Ft
$120/Sq Ft
Est. Value
About This Home
This home is located at 2246 Riverwood Trails Dr Unit 2246, Florissant, MO 63031 and is currently estimated at $170,716, approximately $119 per square foot. 2246 Riverwood Trails Dr Unit 2246 is a home located in St. Louis County with nearby schools including Russell Elementary School, West Middle School, and Hazelwood West High School.
Ownership History
Date
Name
Owned For
Owner Type
Purchase Details
Closed on
Feb 12, 2024
Sold by
Second Amendment Restatement Of Revocabl
Bought by
Revocable Living Trust and Schnell
Current Estimated Value
Purchase Details
Closed on
Dec 13, 2022
Sold by
Schnell Nancy E
Bought by
Revocable Living Trust
Purchase Details
Closed on
Oct 3, 2018
Sold by
Schnell Nancy E
Bought by
Schnell Nancy E and The Revocable Living Trust Of Nancy E Sc
Purchase Details
Closed on
Apr 21, 2005
Sold by
Schnell Nancy
Bought by
Revocable Living Trust Of Nancy Schnell
Purchase Details
Closed on
Jan 25, 2005
Sold by
Foster Mary E
Bought by
Schnell Nancy
Home Financials for this Owner
Home Financials are based on the most recent Mortgage that was taken out on this home.
Original Mortgage
$123,000
Interest Rate
5.82%
Mortgage Type
Purchase Money Mortgage
Create a Home Valuation Report for This Property
The Home Valuation Report is an in-depth analysis detailing your home's value as well as a comparison with similar homes in the area
Home Values in the Area
Average Home Value in this Area
Purchase History
| Date | Buyer | Sale Price | Title Company |
|---|---|---|---|
| Revocable Living Trust | -- | None Listed On Document | |
| Revocable Living Trust | -- | -- | |
| Schnell Nancy E | -- | None Available | |
| Revocable Living Trust Of Nancy Schnell | -- | -- | |
| Schnell Nancy | $123,000 | -- |
Source: Public Records
Mortgage History
| Date | Status | Borrower | Loan Amount |
|---|---|---|---|
| Previous Owner | Schnell Nancy | $123,000 |
Source: Public Records
Tax History Compared to Growth
Tax History
| Year | Tax Paid | Tax Assessment Tax Assessment Total Assessment is a certain percentage of the fair market value that is determined by local assessors to be the total taxable value of land and additions on the property. | Land | Improvement |
|---|---|---|---|---|
| 2025 | $2,142 | $27,840 | $3,800 | $24,040 |
| 2024 | $2,142 | $26,620 | $2,570 | $24,050 |
| 2023 | $2,163 | $26,620 | $2,570 | $24,050 |
| 2022 | $1,985 | $21,840 | $3,120 | $18,720 |
| 2021 | $1,951 | $21,840 | $3,120 | $18,720 |
| 2020 | $1,954 | $20,470 | $3,120 | $17,350 |
| 2019 | $1,925 | $20,470 | $3,120 | $17,350 |
| 2018 | $1,880 | $18,530 | $1,350 | $17,180 |
| 2017 | $1,878 | $18,530 | $1,350 | $17,180 |
| 2016 | $1,946 | $18,990 | $3,120 | $15,870 |
| 2015 | $1,869 | $18,990 | $3,120 | $15,870 |
| 2014 | $1,834 | $18,560 | $3,760 | $14,800 |
Source: Public Records
Map
Nearby Homes
- 248 Chianti Ct
- 924 Zohner Ct
- 1030 Gifford Ct
- 2 Taylor Trail Place
- 12 Miraclair Dr
- 5 Seminary Ct
- 60 Charbonier Bluffs Dr
- 154 Riverwood Park Dr
- 121 Kendl Ct
- 1135 Martin Manor Place
- 1090 Howdershell Rd
- 1035 Rosary Tree Ct
- 7250 Howdershell Rd
- 1227 Teson Rd
- 95 Charbonier Bluffs Dr
- 7240 Howdershell Rd
- 2324 Fernau Ct
- 2 Berwick at Koch Park Manors
- 2320 Fernau Ct
- 2316 Fernau Ct
- 2248 Riverwood Trails Dr
- 2244 Riverwood Trails Dr Unit 2244
- 2238 Riverwood Trails Dr
- 2240 Riverwood Trails Dr
- 2242 Riverwood Trails Dr Unit 2242
- 2252 Riverwood Trails Dr Unit 2252
- 2258 Riverwood Trails Dr
- 2232 Riverwood Trails Dr Unit 2232
- 2254 Riverwood Trails Dr Unit 2254
- 2256 Riverwood Trails Dr
- 2234 Riverwood Trails Dr Unit 2234
- 2260 Riverwood Trails Dr
- 2230 Riverwood Trails Dr
- 2264 Riverwood Trails Dr
- 2266 Riverwood Trails Dr
- 2224 Riverwood Trails Dr Unit 2224
- 2220 Riverwood Trails Dr
- 2272 Riverwood Trails Dr Unit 2272
- 2276 Riverwood Trails Dr
- 2274 Riverwood Trails Dr