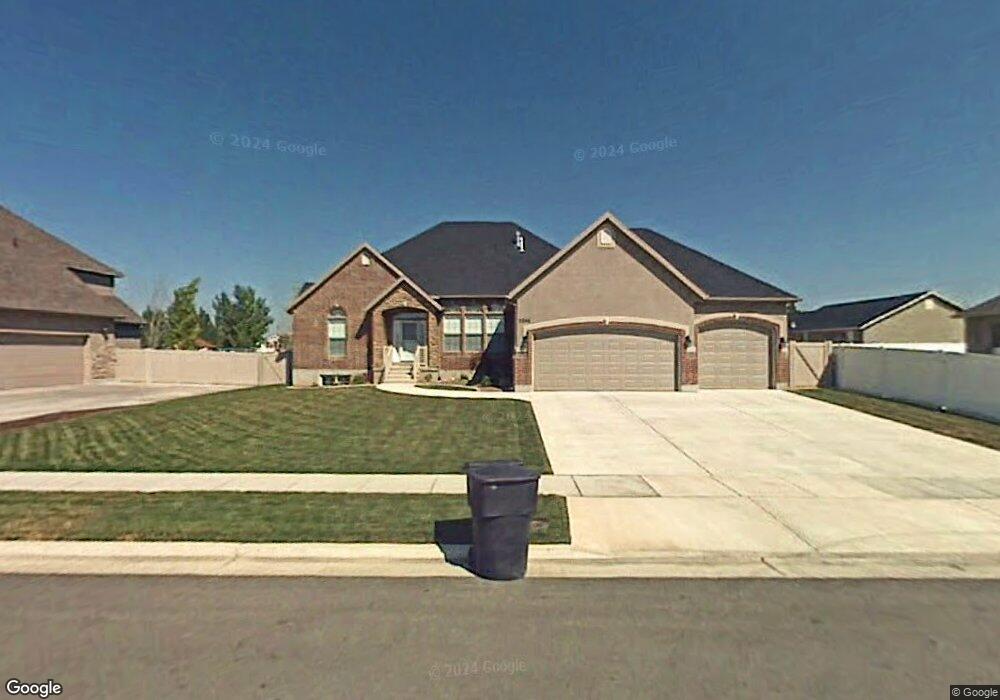
2246 W 1825 S Syracuse, UT 84075
Estimated Value: $669,000 - $764,690
5
Beds
3
Baths
4,488
Sq Ft
$161/Sq Ft
Est. Value
About This Home
This home is located at 2246 W 1825 S, Syracuse, UT 84075 and is currently estimated at $720,423, approximately $160 per square foot. 2246 W 1825 S is a home located in Davis County with nearby schools including Syracuse Elementary School, Syracuse Junior High School, and Syracuse High School.
Ownership History
Date
Name
Owned For
Owner Type
Purchase Details
Closed on
Oct 27, 2009
Sold by
Vanhoorn Fred and Van Hoorn Brenda L
Bought by
Munns Shawn P
Current Estimated Value
Home Financials for this Owner
Home Financials are based on the most recent Mortgage that was taken out on this home.
Original Mortgage
$346,311
Outstanding Balance
$225,442
Interest Rate
5.02%
Mortgage Type
FHA
Estimated Equity
$494,981
Purchase Details
Closed on
Oct 26, 2009
Sold by
Munns Shawn P
Bought by
Munns Shawn P and Munns Jayme L
Home Financials for this Owner
Home Financials are based on the most recent Mortgage that was taken out on this home.
Original Mortgage
$346,311
Outstanding Balance
$225,442
Interest Rate
5.02%
Mortgage Type
FHA
Estimated Equity
$494,981
Purchase Details
Closed on
Feb 22, 2005
Sold by
Bnchmark Real Estate Co
Bought by
Vanvanhoorn Fred Van and Hoorn Brenda L Van
Home Financials for this Owner
Home Financials are based on the most recent Mortgage that was taken out on this home.
Original Mortgage
$235,920
Interest Rate
5.73%
Mortgage Type
New Conventional
Create a Home Valuation Report for This Property
The Home Valuation Report is an in-depth analysis detailing your home's value as well as a comparison with similar homes in the area
Home Values in the Area
Average Home Value in this Area
Purchase History
| Date | Buyer | Sale Price | Title Company |
|---|---|---|---|
| Munns Shawn P | -- | Bonneville Superior Title Co | |
| Munns Shawn P | -- | Accommodation | |
| Vanvanhoorn Fred Van | -- | None Available |
Source: Public Records
Mortgage History
| Date | Status | Borrower | Loan Amount |
|---|---|---|---|
| Open | Munns Shawn P | $346,311 | |
| Previous Owner | Vanvanhoorn Fred Van | $235,920 |
Source: Public Records
Tax History Compared to Growth
Tax History
| Year | Tax Paid | Tax Assessment Tax Assessment Total Assessment is a certain percentage of the fair market value that is determined by local assessors to be the total taxable value of land and additions on the property. | Land | Improvement |
|---|---|---|---|---|
| 2025 | $4,150 | $400,400 | $124,377 | $276,023 |
| 2024 | $4,099 | $398,200 | $102,310 | $295,890 |
| 2023 | $3,853 | $682,000 | $142,589 | $539,411 |
| 2022 | $4,076 | $395,450 | $82,156 | $313,294 |
| 2021 | $3,509 | $527,000 | $121,346 | $405,654 |
| 2020 | $3,136 | $456,000 | $105,986 | $350,014 |
| 2019 | $3,107 | $446,000 | $103,253 | $342,747 |
| 2018 | $2,891 | $412,000 | $99,905 | $312,095 |
| 2016 | $2,661 | $198,825 | $38,358 | $160,467 |
| 2015 | $2,696 | $191,840 | $38,358 | $153,482 |
| 2014 | $2,292 | $166,213 | $38,358 | $127,855 |
| 2013 | -- | $177,333 | $32,571 | $144,762 |
Source: Public Records
Map
Nearby Homes
- 4344 W 1825 S Unit 102
- 4354 W 1825 S Unit 104
- 4348 W 1825 S Unit 103
- 1932 S 2150 W
- 1641 S 2350 W Unit B
- 1918 S 2465 W
- 2297 W 2175 S
- 2679 W Antelope Dr
- 2136 W 2200 S
- 2104 W 2200 S
- 2000 S 1800 W
- 2117 W 1275 S
- 2082 S 1730 W
- 2194 S 1800 W
- 1466 Earl Cir
- 2236 S 2685 W
- 2655 S 2430 W Unit 120
- 2665 S 2430 W Unit 118
- 2655 S 2430 W Unit 116
- 2633 S 2430 W Unit 113