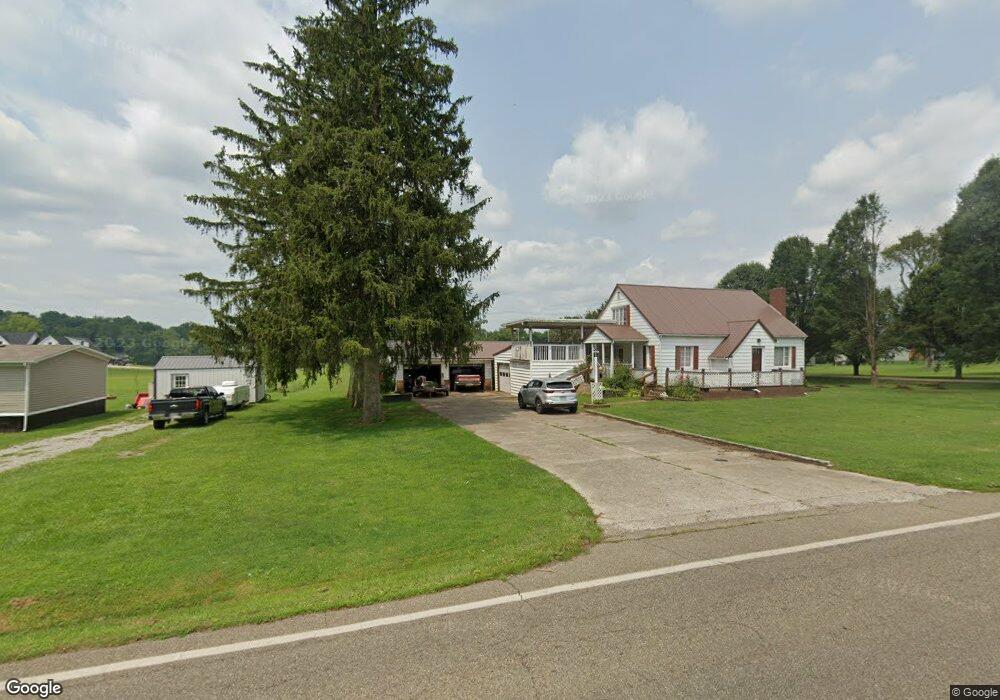
2247 3rd St Syracuse, OH 45779
Estimated Value: $173,000 - $208,000
3
Beds
2
Baths
1,339
Sq Ft
$141/Sq Ft
Est. Value
About This Home
This home is located at 2247 3rd St, Syracuse, OH 45779 and is currently estimated at $189,302, approximately $141 per square foot. 2247 3rd St is a home.
Ownership History
Date
Name
Owned For
Owner Type
Purchase Details
Closed on
Nov 10, 2009
Sold by
Roush Roger Franklin
Bought by
Roush Walter William
Current Estimated Value
Purchase Details
Closed on
May 26, 2009
Sold by
Roush Robert Gerald
Bought by
Roush Walter William and Roush Roger Franklin
Purchase Details
Closed on
Dec 27, 2007
Sold by
Roush Nathan and Roush Carolyn S
Bought by
Roush Walter William and Roush Roger Franklin
Create a Home Valuation Report for This Property
The Home Valuation Report is an in-depth analysis detailing your home's value as well as a comparison with similar homes in the area
Purchase History
| Date | Buyer | Sale Price | Title Company |
|---|---|---|---|
| Roush Walter William | -- | None Available | |
| Roush Walter William | -- | None Available | |
| Roush Walter William | -- | None Available |
Source: Public Records
Tax History
| Year | Tax Paid | Tax Assessment Tax Assessment Total Assessment is a certain percentage of the fair market value that is determined by local assessors to be the total taxable value of land and additions on the property. | Land | Improvement |
|---|---|---|---|---|
| 2025 | $1,375 | $35,540 | $13,020 | $22,520 |
| 2024 | $1,375 | $28,900 | $9,640 | $19,260 |
| 2023 | $1,149 | $28,900 | $9,640 | $19,260 |
| 2022 | $1,136 | $28,900 | $9,640 | $19,260 |
| 2021 | $936 | $22,320 | $7,560 | $14,760 |
| 2020 | $1,066 | $22,320 | $7,560 | $14,760 |
| 2019 | $1,066 | $22,320 | $7,560 | $14,760 |
| 2018 | $970 | $20,080 | $5,690 | $14,390 |
| 2017 | $970 | $20,080 | $5,690 | $14,390 |
| 2016 | $962 | $20,080 | $5,690 | $14,390 |
| 2014 | $1,076 | $24,340 | $4,740 | $19,600 |
| 2013 | $1,076 | $24,340 | $4,740 | $19,600 |
Source: Public Records
Map
Nearby Homes
Your Personal Tour Guide
Ask me questions while you tour the home.