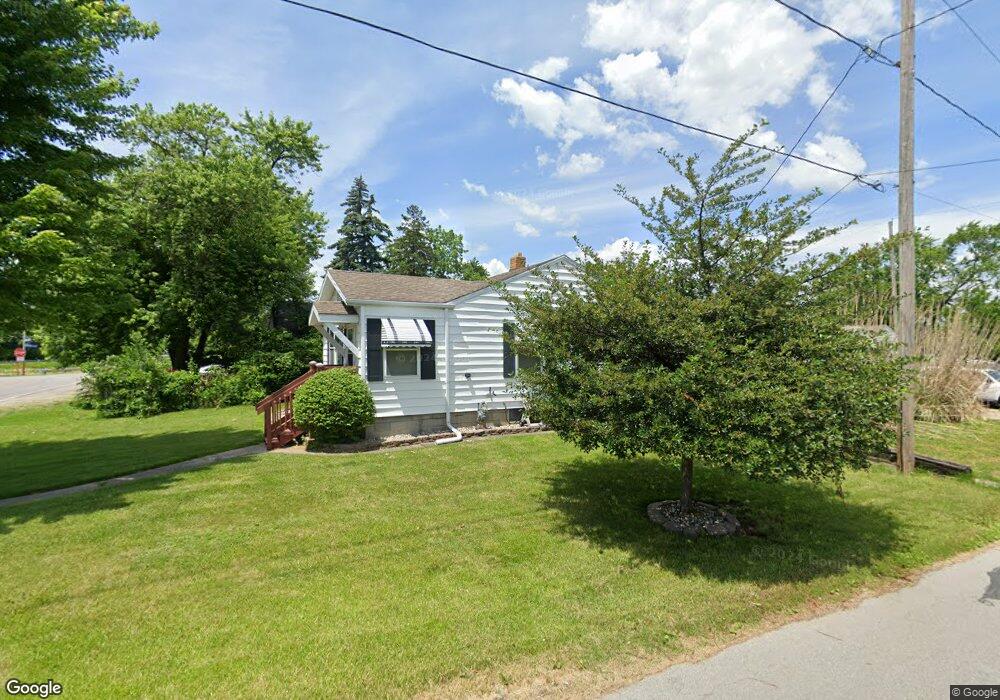
2247 Brown Rd Oregon, OH 43616
Estimated Value: $146,000 - $157,031
3
Beds
2
Baths
1,141
Sq Ft
$132/Sq Ft
Est. Value
About This Home
This home is located at 2247 Brown Rd, Oregon, OH 43616 and is currently estimated at $151,008, approximately $132 per square foot. 2247 Brown Rd is a home located in Lucas County with nearby schools including Kateri Catholic Academy and St. Kateri Catholic Schools.
Ownership History
Date
Name
Owned For
Owner Type
Purchase Details
Closed on
May 25, 2011
Sold by
Fannie Mae
Bought by
May Jason C
Current Estimated Value
Home Financials for this Owner
Home Financials are based on the most recent Mortgage that was taken out on this home.
Original Mortgage
$60,335
Outstanding Balance
$42,423
Interest Rate
5.37%
Mortgage Type
FHA
Estimated Equity
$108,585
Purchase Details
Closed on
Feb 17, 2010
Sold by
Campbell Kenneth A
Bought by
Federal National Mortgage Association
Purchase Details
Closed on
Aug 9, 1995
Sold by
Est Lowell K Leidel
Bought by
Campbell Kenneth A and Tanesky Tamara L
Home Financials for this Owner
Home Financials are based on the most recent Mortgage that was taken out on this home.
Original Mortgage
$53,350
Interest Rate
7.51%
Mortgage Type
New Conventional
Purchase Details
Closed on
Apr 24, 1990
Sold by
Leidel Lowel K and Leidel Grace F
Purchase Details
Closed on
May 1, 1989
Sold by
Leidel L F and G F
Create a Home Valuation Report for This Property
The Home Valuation Report is an in-depth analysis detailing your home's value as well as a comparison with similar homes in the area
Home Values in the Area
Average Home Value in this Area
Purchase History
| Date | Buyer | Sale Price | Title Company |
|---|---|---|---|
| May Jason C | $39,900 | None Available | |
| Federal National Mortgage Association | $56,667 | None Available | |
| Campbell Kenneth A | $53,000 | -- | |
| -- | -- | -- | |
| -- | -- | -- |
Source: Public Records
Mortgage History
| Date | Status | Borrower | Loan Amount |
|---|---|---|---|
| Open | May Jason C | $60,335 | |
| Previous Owner | Campbell Kenneth A | $53,350 |
Source: Public Records
Tax History
| Year | Tax Paid | Tax Assessment Tax Assessment Total Assessment is a certain percentage of the fair market value that is determined by local assessors to be the total taxable value of land and additions on the property. | Land | Improvement |
|---|---|---|---|---|
| 2025 | -- | $40,740 | $7,385 | $33,355 |
| 2024 | $980 | $40,740 | $7,385 | $33,355 |
| 2023 | $2,070 | $36,785 | $6,440 | $30,345 |
| 2022 | $2,084 | $36,785 | $6,440 | $30,345 |
| 2021 | $2,100 | $36,785 | $6,440 | $30,345 |
| 2020 | $1,936 | $30,100 | $5,250 | $24,850 |
| 2019 | $1,882 | $30,100 | $5,250 | $24,850 |
| 2018 | $1,849 | $30,100 | $5,250 | $24,850 |
| 2017 | $1,857 | $27,825 | $5,950 | $21,875 |
| 2016 | $1,834 | $79,500 | $17,000 | $62,500 |
| 2015 | $1,823 | $79,500 | $17,000 | $62,500 |
| 2014 | $1,664 | $27,310 | $5,850 | $21,460 |
| 2013 | $1,664 | $27,310 | $5,850 | $21,460 |
Source: Public Records
Map
Nearby Homes
- 2011 Oakdale Ave
- 2249 Pickle Rd
- 2432 Rochester Place
- 2826 Olde Curtice Rd
- 1512 Vinal St
- 1531 Freedom St
- 1532 Liberty St
- 1508 Albert St
- 1413 Ironwood Ave
- 230 Ritter Ave
- 1401 Liberty St
- 1219 Crystal St
- 1230 Hirzel St
- 1122 Vinal St
- 2074 Price St
- 674 Sylvandale Ave
- 3517 Goodrich Ave
- 1225 Varland Ave
- 1701 Milroy Ave
- 29 Lemoyne Rd
Your Personal Tour Guide
Ask me questions while you tour the home.