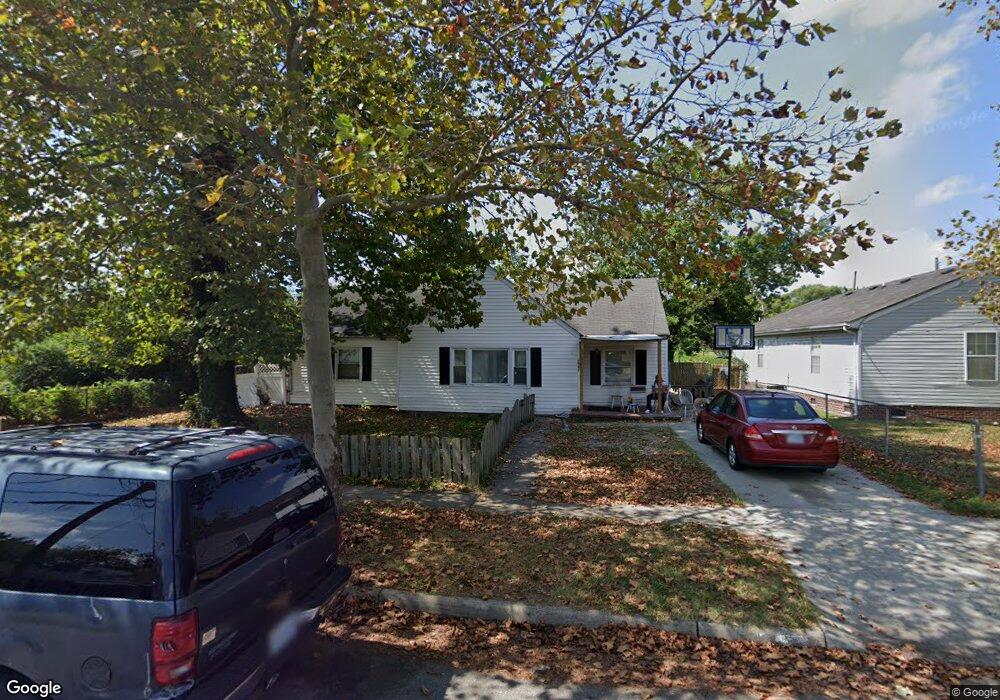
2247 Courtney Ave Norfolk, VA 23504
Barraud Park NeighborhoodEstimated Value: $264,000 - $326,000
4
Beds
3
Baths
1,600
Sq Ft
$184/Sq Ft
Est. Value
About This Home
This home is located at 2247 Courtney Ave, Norfolk, VA 23504 and is currently estimated at $294,401, approximately $184 per square foot. 2247 Courtney Ave is a home located in Norfolk City with nearby schools including Jacox Elementary School, Ruffner Middle School, and Granby High School.
Ownership History
Date
Name
Owned For
Owner Type
Purchase Details
Closed on
Jul 20, 2024
Sold by
Mozart Investment Llc
Bought by
Adams Brandon and Adams Cassandra
Current Estimated Value
Home Financials for this Owner
Home Financials are based on the most recent Mortgage that was taken out on this home.
Original Mortgage
$291,127
Outstanding Balance
$287,569
Interest Rate
6.87%
Mortgage Type
VA
Estimated Equity
$6,832
Purchase Details
Closed on
Dec 20, 2023
Sold by
Calcagni Llc
Bought by
Mozart Investment Llc
Home Financials for this Owner
Home Financials are based on the most recent Mortgage that was taken out on this home.
Original Mortgage
$130,000
Interest Rate
7.5%
Mortgage Type
New Conventional
Purchase Details
Closed on
Sep 27, 2011
Sold by
U S Bank National Association
Bought by
Calcagni Llc
Purchase Details
Closed on
Feb 2, 2011
Sold by
Cole Larry Howard and Cole Marjorie D
Bought by
U S Bank National Association
Create a Home Valuation Report for This Property
The Home Valuation Report is an in-depth analysis detailing your home's value as well as a comparison with similar homes in the area
Home Values in the Area
Average Home Value in this Area
Purchase History
| Date | Buyer | Sale Price | Title Company |
|---|---|---|---|
| Adams Brandon | $285,000 | Fidelity National Title | |
| Mozart Investment Llc | $75,000 | Stewart Title | |
| Calcagni Llc | $31,001 | Stewart Title Guaranty Co | |
| U S Bank National Association | $236,692 | None Available |
Source: Public Records
Mortgage History
| Date | Status | Borrower | Loan Amount |
|---|---|---|---|
| Open | Adams Brandon | $291,127 | |
| Previous Owner | Mozart Investment Llc | $130,000 |
Source: Public Records
Tax History Compared to Growth
Tax History
| Year | Tax Paid | Tax Assessment Tax Assessment Total Assessment is a certain percentage of the fair market value that is determined by local assessors to be the total taxable value of land and additions on the property. | Land | Improvement |
|---|---|---|---|---|
| 2025 | $4,001 | $320,100 | $100,700 | $219,400 |
| 2024 | $3,507 | $198,900 | $100,700 | $98,200 |
| 2023 | $2,350 | $188,000 | $91,200 | $96,800 |
| 2022 | $1,996 | $159,700 | $70,300 | $89,400 |
| 2021 | $1,571 | $125,700 | $51,000 | $74,700 |
| 2020 | $1,515 | $121,200 | $46,500 | $74,700 |
| 2019 | $1,515 | $121,200 | $46,500 | $74,700 |
| 2018 | $1,503 | $120,200 | $46,500 | $73,700 |
| 2017 | $1,367 | $118,900 | $46,500 | $72,400 |
| 2016 | $1,367 | $115,900 | $46,500 | $69,400 |
| 2015 | $1,310 | $115,900 | $46,500 | $69,400 |
| 2014 | $1,310 | $115,900 | $46,500 | $69,400 |
Source: Public Records
Map
Nearby Homes
- 2323 Courtney Ave
- 2317 Hanson Ave
- 2220 Hanson Ave
- 2229 Maltby Ave
- 1032 Anderson St
- 2406 Hanson Ave
- 2410 Hanson Ave
- 2405 Maltby Ave
- 2414 Hanson Ave
- 2411 Maltby Ave
- 2418 Hanson Ave
- 2415 Maltby Ave
- 2216 Reservoir Ave
- 1005 Saint Julian Ave
- 962 Saint Julian Ave
- 1456 Calhoun St
- 1825 Tidewater Dr
- 1815 Tidewater Dr
- 2222 Marshall Ave
- 2226 Marshall Ave
- 2243 Courtney Ave
- 1135 Wall St
- 2239 Courtney Ave
- 2252 Barraud Ave Unit 6
- 2252 Barraud Ave
- 2248 Barraud Ave
- 1014 Wall St
- 2244 Barraud Ave
- 2235 Courtney Ave
- 2240 Barraud Ave
- 2244 Courtney Ave
- 2240 Courtney Ave
- 2301 Courtney Ave
- 1201 Wall St
- 2238 Courtney Ave
- 2233 Courtney Ave
- 2246 Barraud Ave
- 2302 Barraud Ave
- 2238 Barraud Ave
- 2232 Courtney Ave