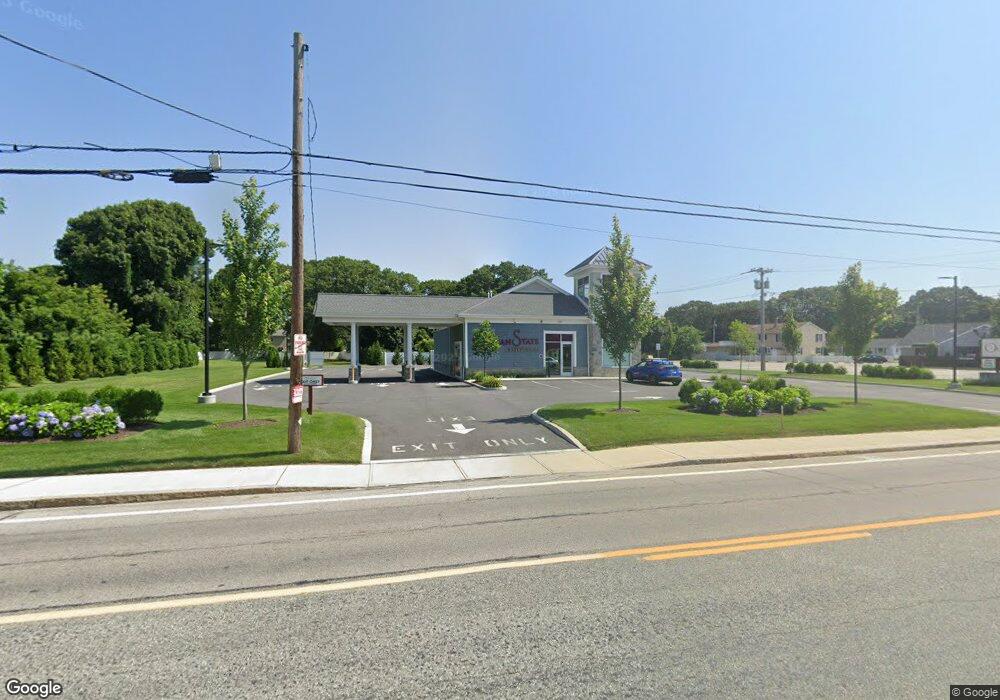
2247 W Shore Rd Warwick, RI 02889
Wildes Corner NeighborhoodEstimated Value: $709,739
--
Bed
--
Bath
2,564
Sq Ft
$277/Sq Ft
Est. Value
About This Home
This home is located at 2247 W Shore Rd, Warwick, RI 02889 and is currently estimated at $709,739, approximately $276 per square foot. 2247 W Shore Rd is a home located in Kent County with nearby schools including Saint Kevin School, St Rose Of Lima School, and Bishop Hendricken High School.
Ownership History
Date
Name
Owned For
Owner Type
Purchase Details
Closed on
Jun 1, 2020
Sold by
Cada Llc
Bought by
Ocean State Cu
Current Estimated Value
Purchase Details
Closed on
Jun 25, 2015
Sold by
Mor Realty Inc
Bought by
Cada Llc
Home Financials for this Owner
Home Financials are based on the most recent Mortgage that was taken out on this home.
Original Mortgage
$6,475
Interest Rate
3.84%
Mortgage Type
Commercial
Purchase Details
Closed on
Jan 11, 2000
Sold by
Bassett George A and Bassett Laura P
Bought by
Mor Realty Inc
Home Financials for this Owner
Home Financials are based on the most recent Mortgage that was taken out on this home.
Original Mortgage
$235,000
Interest Rate
7.73%
Mortgage Type
Commercial
Create a Home Valuation Report for This Property
The Home Valuation Report is an in-depth analysis detailing your home's value as well as a comparison with similar homes in the area
Home Values in the Area
Average Home Value in this Area
Purchase History
| Date | Buyer | Sale Price | Title Company |
|---|---|---|---|
| Ocean State Cu | $440,000 | None Available | |
| Cada Llc | $400,000 | -- | |
| Mor Realty Inc | $275,000 | -- |
Source: Public Records
Mortgage History
| Date | Status | Borrower | Loan Amount |
|---|---|---|---|
| Previous Owner | Mor Realty Inc | $6,475 | |
| Previous Owner | Mor Realty Inc | $530,000 | |
| Previous Owner | Mor Realty Inc | $235,000 |
Source: Public Records
Tax History Compared to Growth
Tax History
| Year | Tax Paid | Tax Assessment Tax Assessment Total Assessment is a certain percentage of the fair market value that is determined by local assessors to be the total taxable value of land and additions on the property. | Land | Improvement |
|---|---|---|---|---|
| 2025 | $24,455 | $1,019,400 | $289,300 | $730,100 |
| 2024 | $25,535 | $1,008,500 | $247,900 | $760,600 |
| 2023 | $14,543 | $585,700 | $247,900 | $337,800 |
| 2022 | $10,206 | $363,200 | $150,800 | $212,400 |
| 2021 | $10,206 | $363,200 | $150,800 | $212,400 |
| 2020 | $10,206 | $363,200 | $150,800 | $212,400 |
| 2019 | $10,206 | $363,200 | $150,800 | $212,400 |
| 2018 | $10,996 | $362,200 | $188,600 | $173,600 |
| 2017 | $10,996 | $362,200 | $188,600 | $173,600 |
| 2016 | $10,996 | $362,200 | $188,600 | $173,600 |
| 2015 | $12,798 | $411,100 | $214,300 | $196,800 |
| 2014 | -- | $411,100 | $214,300 | $196,800 |
| 2013 | $12,201 | $411,100 | $214,300 | $196,800 |
Source: Public Records
Map
Nearby Homes
- 136 Sefton Ave
- 86 Glen Dr
- 176 Canfield Ave
- 191 Canfield Ave
- 700 Sandy Ln Unit 6
- 700 Sandy Ln Unit 17
- 700 Sandy Ln Unit 18
- 700 Sandy Ln Unit 1
- 9 Chelmsford Ave
- 206 Reynolds Ave
- 31 Oakhurst Ave
- 34 Pequot Ave
- 183 Shand Ave
- 75 Northup St
- 71 Northup St
- 80 Northup St
- 985 Cedar Swamp Rd
- 117 Second Point Rd
- 209 Wood St
- 199 Cottage Grove Ave