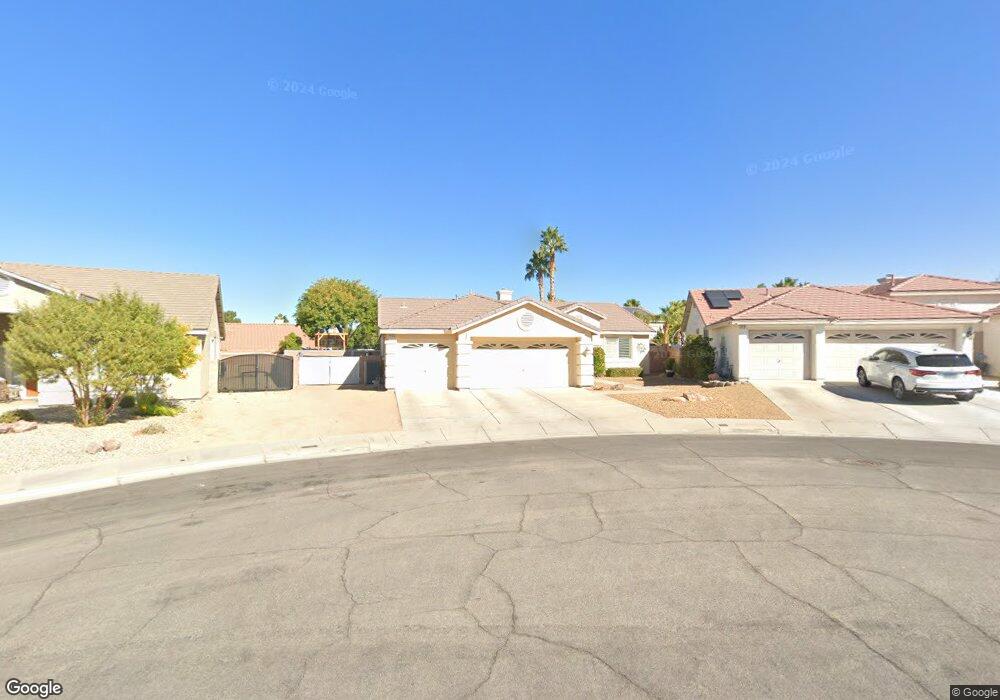
2248 Early Frost Ave Unit 1 Henderson, NV 89052
Green Valley Ranch NeighborhoodEstimated Value: $594,000 - $673,000
3
Beds
2
Baths
1,879
Sq Ft
$331/Sq Ft
Est. Value
About This Home
This home is located at 2248 Early Frost Ave Unit 1, Henderson, NV 89052 and is currently estimated at $622,337, approximately $331 per square foot. 2248 Early Frost Ave Unit 1 is a home located in Clark County with nearby schools including John Vanderburg Elementary School, Neil C. Twitchell Elementary School, and Bob Miller Middle School.
Ownership History
Date
Name
Owned For
Owner Type
Purchase Details
Closed on
Oct 19, 2023
Sold by
Skinner George R and Skinner Joann M
Bought by
George And Joann Skinner Trust and Skinner
Current Estimated Value
Purchase Details
Closed on
Feb 14, 2002
Sold by
Marchand Robert R and Glass Gail G
Bought by
Skinner George R and Skinner Joann M
Home Financials for this Owner
Home Financials are based on the most recent Mortgage that was taken out on this home.
Original Mortgage
$100,000
Interest Rate
7.04%
Purchase Details
Closed on
Nov 18, 1996
Sold by
Hunters Ridge Ltd Liability Company
Bought by
Marchand Robert R and Glass Gail G
Home Financials for this Owner
Home Financials are based on the most recent Mortgage that was taken out on this home.
Original Mortgage
$139,250
Interest Rate
8.75%
Create a Home Valuation Report for This Property
The Home Valuation Report is an in-depth analysis detailing your home's value as well as a comparison with similar homes in the area
Home Values in the Area
Average Home Value in this Area
Purchase History
| Date | Buyer | Sale Price | Title Company |
|---|---|---|---|
| George And Joann Skinner Trust | -- | None Listed On Document | |
| Skinner George R | $235,000 | Nevada Title Company | |
| Marchand Robert R | $166,000 | United Title |
Source: Public Records
Mortgage History
| Date | Status | Borrower | Loan Amount |
|---|---|---|---|
| Previous Owner | Skinner George R | $100,000 | |
| Previous Owner | Marchand Robert R | $139,250 |
Source: Public Records
Tax History Compared to Growth
Tax History
| Year | Tax Paid | Tax Assessment Tax Assessment Total Assessment is a certain percentage of the fair market value that is determined by local assessors to be the total taxable value of land and additions on the property. | Land | Improvement |
|---|---|---|---|---|
| 2025 | $2,907 | $150,929 | $61,600 | $89,329 |
| 2024 | $2,823 | $150,929 | $61,600 | $89,329 |
| 2023 | $2,823 | $138,302 | $53,900 | $84,402 |
| 2022 | $2,746 | $120,882 | $43,050 | $77,832 |
| 2021 | $2,668 | $116,714 | $42,700 | $74,014 |
| 2020 | $2,587 | $116,323 | $42,700 | $73,623 |
| 2019 | $2,512 | $105,469 | $32,900 | $72,569 |
| 2018 | $2,518 | $99,625 | $29,400 | $70,225 |
| 2017 | $2,861 | $98,706 | $27,300 | $71,406 |
| 2016 | $2,384 | $95,285 | $23,100 | $72,185 |
| 2015 | $2,380 | $88,248 | $17,500 | $70,748 |
| 2014 | $2,310 | $83,636 | $14,875 | $68,761 |
Source: Public Records
Map
Nearby Homes
- 512 First Light St
- 494 Cape Alan Dr
- 487 Donavista Ct
- 2265 Coral Ridge Ave
- 2262 Alanhurst Dr Unit 2
- 545 Teovani St Unit 1026
- 489 Annet St
- 2257 Candlestick Ave
- 2255 Candlestick Ave
- 2272 Coral Ridge Ave
- 480 Mission Springs St
- 536 Copper View St
- 2381 Goldfire Cir
- 473 Mission Springs St
- 445 Golden State St
- 2412 Goldfire Cir
- 415 Golden State St
- 464 Beardsley Cir
- 2388 Kenneth Ave
- 442 Beardsley Cir
- 510 Fox Horn Rd
- 2250 Early Frost Ave
- 2243 Verde Cape Ave
- 2245 Verde Cape Ave
- 2241 Verde Cape Ave
- 512 Fox Horn Rd
- 2247 Verde Cape Ave
- 2247 Verde Cape Ave Unit None
- 2252 Early Frost Ave
- 2249 Early Frost Ave
- 505 First Light St
- 507 First Light St
- 2249 Verde Cape Ave
- 514 Fox Horn Rd
- 509 First Light St
- 503 First Light St
- 2254 Early Frost Ave
- 2244 Verde Cape Ave
- 2242 Verde Cape Ave
- 511 First Light St