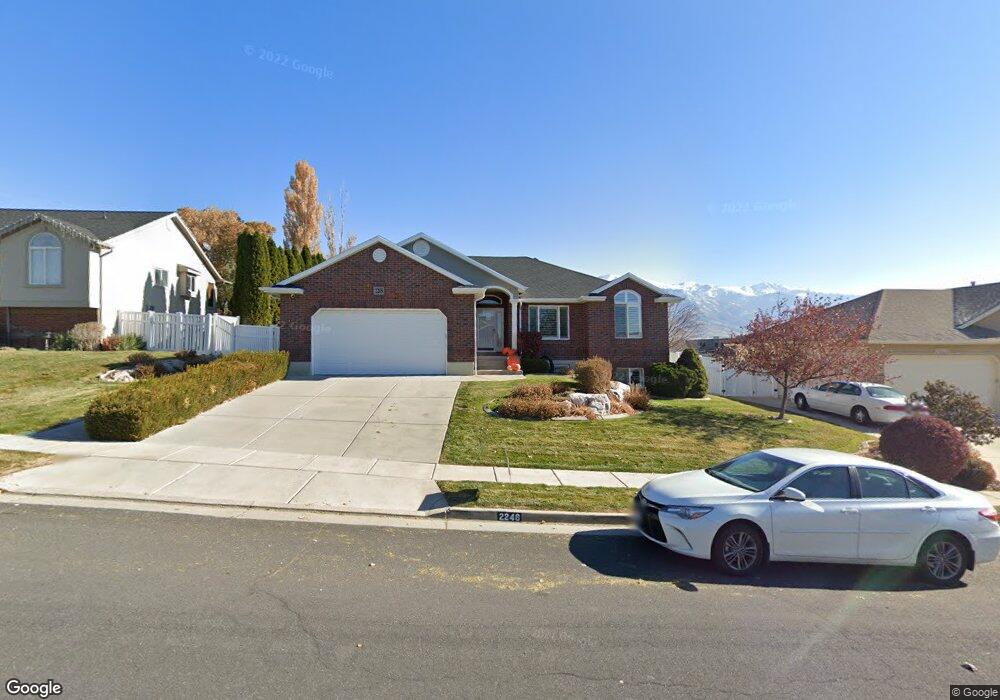
2248 N 75 E Layton, UT 84041
Estimated Value: $563,000 - $600,887
3
Beds
3
Baths
3,061
Sq Ft
$188/Sq Ft
Est. Value
About This Home
This home is located at 2248 N 75 E, Layton, UT 84041 and is currently estimated at $575,722, approximately $188 per square foot. 2248 N 75 E is a home located in Davis County with nearby schools including Lincoln Elementary School, North Layton Junior High School, and Northridge High School.
Ownership History
Date
Name
Owned For
Owner Type
Purchase Details
Closed on
Nov 4, 2014
Sold by
Covalt Ronald L and Covalt Mary S
Bought by
Head Justin G and Head Heather D
Current Estimated Value
Home Financials for this Owner
Home Financials are based on the most recent Mortgage that was taken out on this home.
Original Mortgage
$263,150
Outstanding Balance
$202,261
Interest Rate
4.17%
Mortgage Type
New Conventional
Estimated Equity
$373,461
Purchase Details
Closed on
Oct 7, 2005
Sold by
Covalt Ronald L and Covalt Mary S
Bought by
Covalt Ronald L and Covalt Mary S
Purchase Details
Closed on
Dec 21, 2000
Sold by
Overland Homes Inc
Bought by
Covalt Ronald L and Covalt Mary S
Purchase Details
Closed on
Sep 25, 2000
Sold by
Antelope Ridge Inc
Bought by
Overland Homes Inc
Create a Home Valuation Report for This Property
The Home Valuation Report is an in-depth analysis detailing your home's value as well as a comparison with similar homes in the area
Home Values in the Area
Average Home Value in this Area
Purchase History
| Date | Buyer | Sale Price | Title Company |
|---|---|---|---|
| Head Justin G | -- | Mountain View Title & | |
| Covalt Ronald L | -- | -- | |
| Covalt Ronald L | -- | Bonneville Title Company Inc | |
| Overland Homes Inc | -- | Bonneville Title Company Inc |
Source: Public Records
Mortgage History
| Date | Status | Borrower | Loan Amount |
|---|---|---|---|
| Open | Head Justin G | $263,150 |
Source: Public Records
Tax History
| Year | Tax Paid | Tax Assessment Tax Assessment Total Assessment is a certain percentage of the fair market value that is determined by local assessors to be the total taxable value of land and additions on the property. | Land | Improvement |
|---|---|---|---|---|
| 2025 | $3,097 | $290,400 | $116,005 | $174,395 |
| 2024 | $2,922 | $277,200 | $134,277 | $142,923 |
| 2023 | $2,980 | $505,000 | $151,596 | $353,404 |
| 2022 | $3,060 | $283,800 | $82,523 | $201,277 |
| 2021 | $2,828 | $390,000 | $122,299 | $267,701 |
| 2020 | $2,586 | $341,000 | $100,115 | $240,885 |
| 2019 | $2,615 | $341,000 | $92,612 | $248,388 |
| 2018 | $2,435 | $318,000 | $92,612 | $225,388 |
| 2016 | $2,111 | $144,815 | $31,376 | $113,439 |
| 2015 | $2,137 | $139,975 | $31,376 | $108,599 |
| 2014 | -- | $132,000 | $31,376 | $100,624 |
| 2013 | -- | $120,435 | $31,547 | $88,888 |
Source: Public Records
Map
Nearby Homes
- 12 E 2150 N
- 2311 N 10 W
- 2500 N Fort Ln Unit 212
- 2500 N Fort Ln Unit 244
- 2600 N Hill Field Rd Unit 134
- 2600 N Hill Field Rd Unit 86
- 2600 N Hill Field Rd Unit 71
- 1857 N 50 W
- 1908 N 200 W
- 14 W Belvedere Way
- 262 W 1850 N
- 2214 N 450 W
- 414 E 2625 N
- 2246 N 475 W
- 265 Mindella Way
- 498 W 2200 N
- 506 W 2200 N
- 2236 N 525 W
- 269 Mindella Way Unit A
- 14 Lakeview Dr
Your Personal Tour Guide
Ask me questions while you tour the home.