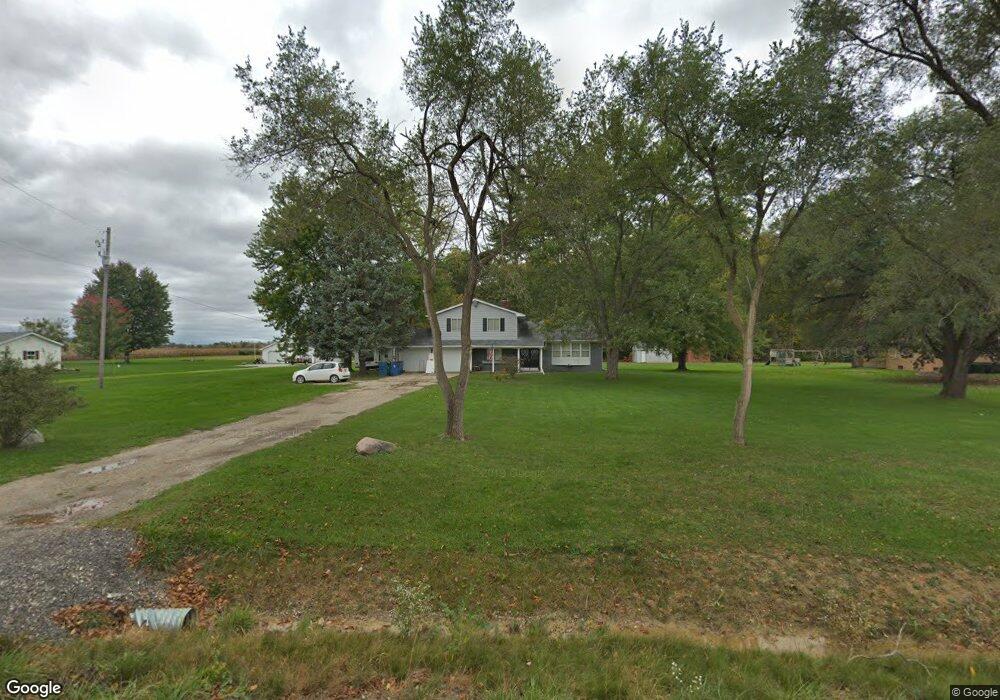
2248 S Nichols Rd Lennon, MI 48449
Estimated Value: $261,296 - $304,000
3
Beds
2
Baths
2,189
Sq Ft
$130/Sq Ft
Est. Value
About This Home
This home is located at 2248 S Nichols Rd, Lennon, MI 48449 and is currently estimated at $283,824, approximately $129 per square foot. 2248 S Nichols Rd is a home located in Genesee County with nearby schools including Syring Elementary School, Elms Road Elementary School, and Dieck Elementary School.
Ownership History
Date
Name
Owned For
Owner Type
Purchase Details
Closed on
Apr 20, 2018
Sold by
Thomas Jeffery J
Bought by
Brinin Gary and Brinin Rita M
Current Estimated Value
Home Financials for this Owner
Home Financials are based on the most recent Mortgage that was taken out on this home.
Original Mortgage
$141,699
Outstanding Balance
$121,887
Interest Rate
4.45%
Mortgage Type
VA
Estimated Equity
$161,937
Purchase Details
Closed on
Nov 2, 2017
Sold by
Castlerock 2017 Llc
Bought by
Thomas Jeffery J
Purchase Details
Closed on
Aug 24, 2017
Sold by
Wells Fargo Bank Na
Bought by
Castlerock 2017 Llc
Purchase Details
Closed on
Nov 2, 2016
Sold by
Wascher Darran M
Bought by
Wells Fargo Bank Na
Purchase Details
Closed on
Nov 20, 2009
Sold by
Bain James D
Bought by
Wascher Darran M
Create a Home Valuation Report for This Property
The Home Valuation Report is an in-depth analysis detailing your home's value as well as a comparison with similar homes in the area
Home Values in the Area
Average Home Value in this Area
Purchase History
| Date | Buyer | Sale Price | Title Company |
|---|---|---|---|
| Brinin Gary | $155,500 | First American Title | |
| Thomas Jeffery J | $85,100 | None Available | |
| Castlerock 2017 Llc | $57,100 | None Available | |
| Wells Fargo Bank Na | -- | None Available | |
| Wascher Darran M | $110,000 | Sky Title Agency |
Source: Public Records
Mortgage History
| Date | Status | Borrower | Loan Amount |
|---|---|---|---|
| Open | Brinin Gary | $141,699 |
Source: Public Records
Tax History Compared to Growth
Tax History
| Year | Tax Paid | Tax Assessment Tax Assessment Total Assessment is a certain percentage of the fair market value that is determined by local assessors to be the total taxable value of land and additions on the property. | Land | Improvement |
|---|---|---|---|---|
| 2025 | $2,776 | $115,000 | $0 | $0 |
| 2024 | $793 | $112,700 | $0 | $0 |
| 2023 | $738 | $96,400 | $0 | $0 |
| 2022 | $2,394 | $84,500 | $0 | $0 |
| 2021 | $2,374 | $76,400 | $0 | $0 |
| 2020 | $675 | $74,700 | $0 | $0 |
| 2019 | $664 | $57,200 | $0 | $0 |
| 2018 | $1,865 | $52,500 | $0 | $0 |
| 2017 | $2,757 | $52,500 | $0 | $0 |
| 2016 | $1,709 | $49,400 | $0 | $0 |
| 2015 | $1,538 | $55,200 | $0 | $0 |
| 2014 | $573 | $50,600 | $0 | $0 |
| 2012 | -- | $48,600 | $48,600 | $0 |
Source: Public Records
Map
Nearby Homes
- 1475 S Nichols Rd
- 11424 Corunna Rd
- 0 Corunna Rd Unit 20251051464
- 10141 McEnrue Rd
- 1309 Houston Dr
- 3086 Seymour Rd
- 12502 W Corunna Rd
- 4014 S Duffield Rd
- 2548 S Sheridan Rd
- V/L S Sheridan Rd
- 241 Raleigh Place
- 908 Tyler Rd
- 805 Oak St
- 3375 Seymour Rd
- 4101 S Sheridan Rd Unit 132
- 1936 Elmwood Dr
- 5051 Nichols Rd
- 0 Corunna Rd Unit 20251034900
- 1445 N Seymour Rd
- 1513 N Seymour Rd
- 2248 Nichols Rd
- 2236 S Nichols Rd
- 2236 Nichols Rd
- 2224 S Nichols Rd
- 2224 Nichols Rd
- 2253 Nichols Rd
- 2245 Nichols Rd
- 2253 S Nichols Rd
- 2214 Nichols Rd
- 2288 Nichols Rd
- 2204 Nichols Rd
- 2215 S Nichols Rd
- 2215 Nichols Rd
- 2267 Nichols Rd
- 2268 Nichols Rd
- 2287 Nichols Rd
- 2194 S Nichols Rd
- 2194 Nichols Rd
- 2312 Nichols Rd
- 2184 Nichols Rd