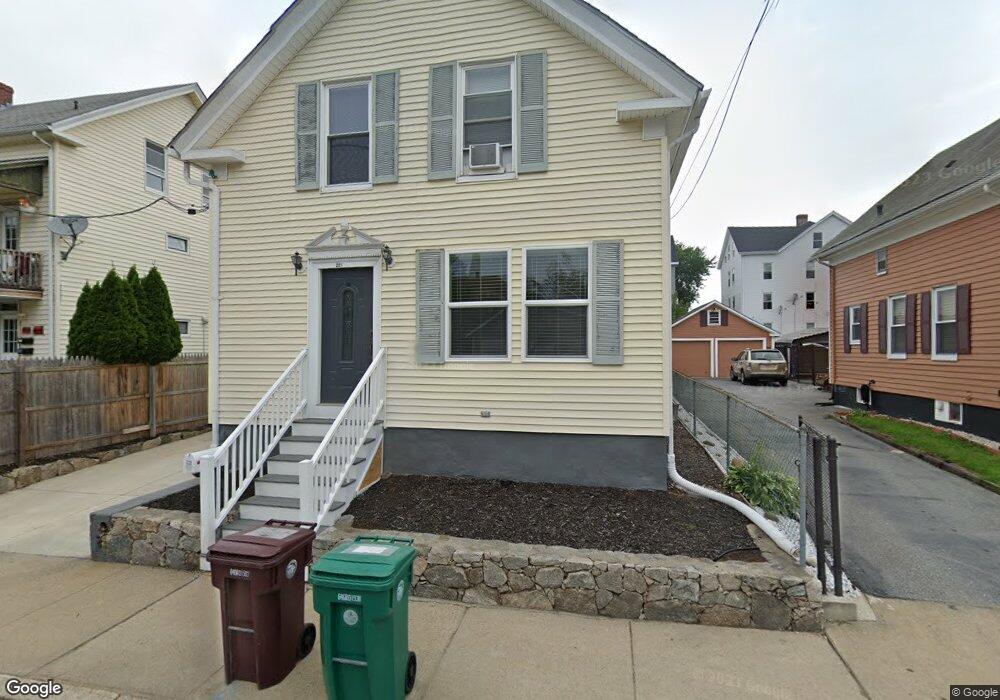
225 4th Ave Woonsocket, RI 02895
Fairmount NeighborhoodEstimated Value: $294,000 - $357,000
4
Beds
1
Bath
1,615
Sq Ft
$201/Sq Ft
Est. Value
About This Home
This home is located at 225 4th Ave, Woonsocket, RI 02895 and is currently estimated at $325,138, approximately $201 per square foot. 225 4th Ave is a home located in Providence County with nearby schools including Woonsocket High School, Rise Prep Mayoral Academy Middle School, and Rise Prep Mayoral Academy.
Ownership History
Date
Name
Owned For
Owner Type
Purchase Details
Closed on
Sep 24, 2004
Sold by
Cavedon Christopher and Thivierge Joshua D
Bought by
Fontaine Rene L and Fontaine Cathy J
Current Estimated Value
Home Financials for this Owner
Home Financials are based on the most recent Mortgage that was taken out on this home.
Original Mortgage
$165,300
Outstanding Balance
$81,371
Interest Rate
5.89%
Mortgage Type
Purchase Money Mortgage
Estimated Equity
$243,767
Purchase Details
Closed on
May 28, 2004
Sold by
Languivand Ray W
Bought by
Cavedon Christopher and Yhivierge Joshua D
Purchase Details
Closed on
Mar 17, 1998
Sold by
Buteau Russell J and Buteau Gloria
Bought by
Languirand Ray W
Create a Home Valuation Report for This Property
The Home Valuation Report is an in-depth analysis detailing your home's value as well as a comparison with similar homes in the area
Home Values in the Area
Average Home Value in this Area
Purchase History
| Date | Buyer | Sale Price | Title Company |
|---|---|---|---|
| Fontaine Rene L | $174,000 | -- | |
| Cavedon Christopher | $118,000 | -- | |
| Languirand Ray W | $75,000 | -- | |
| Fontaine Rene L | $174,000 | -- | |
| Cavedon Christopher | $118,000 | -- | |
| Languirand Ray W | $75,000 | -- |
Source: Public Records
Mortgage History
| Date | Status | Borrower | Loan Amount |
|---|---|---|---|
| Open | Languirand Ray W | $165,300 | |
| Closed | Languirand Ray W | $4,596 | |
| Closed | Languirand Ray W | $165,300 |
Source: Public Records
Tax History
| Year | Tax Paid | Tax Assessment Tax Assessment Total Assessment is a certain percentage of the fair market value that is determined by local assessors to be the total taxable value of land and additions on the property. | Land | Improvement |
|---|---|---|---|---|
| 2025 | $2,806 | $249,900 | $66,400 | $183,500 |
| 2024 | $2,816 | $193,700 | $67,600 | $126,100 |
| 2023 | $2,708 | $193,700 | $67,600 | $126,100 |
| 2022 | $2,708 | $193,700 | $67,600 | $126,100 |
| 2021 | $2,622 | $110,400 | $31,600 | $78,800 |
| 2020 | $2,650 | $110,400 | $31,600 | $78,800 |
| 2018 | $2,658 | $110,400 | $31,600 | $78,800 |
| 2017 | $2,682 | $89,100 | $30,200 | $58,900 |
| 2016 | $2,837 | $89,100 | $30,200 | $58,900 |
| 2015 | $3,259 | $89,100 | $30,200 | $58,900 |
| 2014 | $3,080 | $85,700 | $33,200 | $52,500 |
Source: Public Records
Map
Nearby Homes
- 123 4th Ave
- 83 4th Ave
- 0 10th Ave
- 10 10th Ave
- 36 Fairmount St
- 0 Holbrook Ln Unit 1402850
- 372 River St
- 435 S Main St
- 120 East St
- 308 Harris Ave
- 190 Coe St
- 84 Bernice Ave
- 6 Obeline Dr
- 43 Summit St
- 115 Railroad St
- 42 Transit St
- 184 Avenue C Unit 2
- 184 Avenue C Unit 5
- 184 Avenue C Unit 6
- 184 Avenue C Unit 3
Your Personal Tour Guide
Ask me questions while you tour the home.