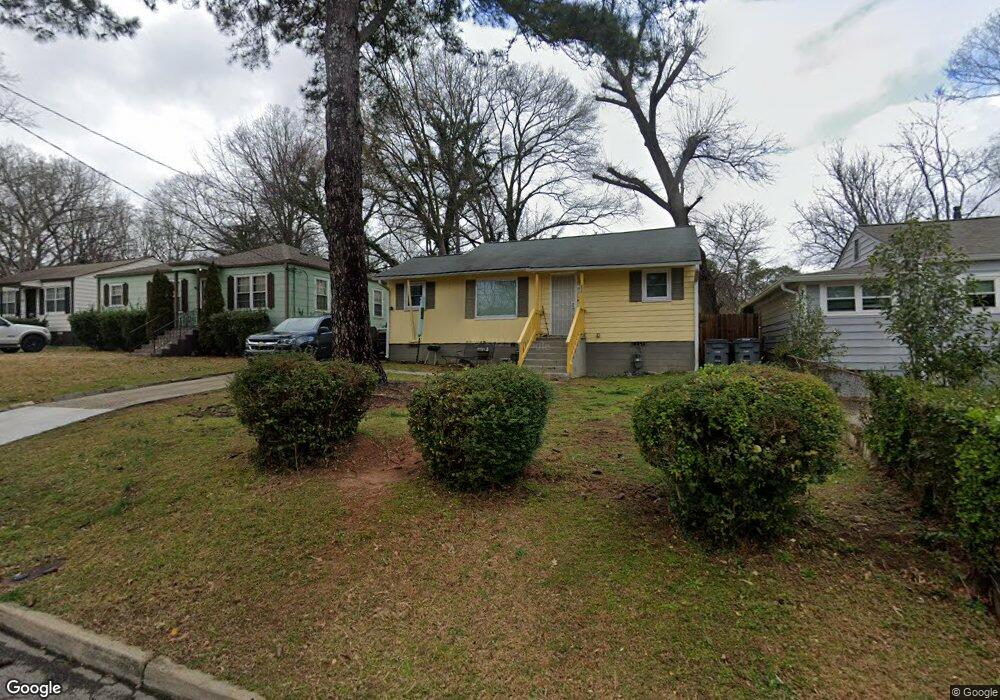
225 Birch St Atlanta, GA 30354
Estimated Value: $186,903 - $274,000
2
Beds
1
Bath
1,064
Sq Ft
$208/Sq Ft
Est. Value
About This Home
This home is located at 225 Birch St, Atlanta, GA 30354 and is currently estimated at $221,226, approximately $207 per square foot. 225 Birch St is a home located in Fulton County with nearby schools including Hapeville Elementary School, Paul D. West Middle School, and Tri-Cities High School.
Ownership History
Date
Name
Owned For
Owner Type
Purchase Details
Closed on
Mar 27, 2019
Sold by
King Cassandra B
Bought by
King Cassandra B and King Karseen
Current Estimated Value
Purchase Details
Closed on
Nov 21, 1996
Sold by
Cox Kevin A
Bought by
King Cassandra B Karsee
Purchase Details
Closed on
Jul 27, 1995
Sold by
Secretary Of Hud
Bought by
Cox Kevin A
Purchase Details
Closed on
Sep 6, 1994
Sold by
Gaskin Mathew Dorothy
Bought by
Secretary Of Hud
Create a Home Valuation Report for This Property
The Home Valuation Report is an in-depth analysis detailing your home's value as well as a comparison with similar homes in the area
Home Values in the Area
Average Home Value in this Area
Purchase History
| Date | Buyer | Sale Price | Title Company |
|---|---|---|---|
| King Cassandra B | -- | -- | |
| King Cassandra B Karsee | $49,900 | -- | |
| Cox Kevin A | -- | -- | |
| Secretary Of Hud | -- | -- |
Source: Public Records
Mortgage History
| Date | Status | Borrower | Loan Amount |
|---|---|---|---|
| Closed | King Cassandra B Karsee | $0 |
Source: Public Records
Tax History Compared to Growth
Tax History
| Year | Tax Paid | Tax Assessment Tax Assessment Total Assessment is a certain percentage of the fair market value that is determined by local assessors to be the total taxable value of land and additions on the property. | Land | Improvement |
|---|---|---|---|---|
| 2025 | $664 | $65,960 | $19,400 | $46,560 |
| 2023 | $2,058 | $72,920 | $23,680 | $49,240 |
| 2022 | $367 | $64,960 | $30,240 | $34,720 |
| 2021 | $871 | $47,840 | $19,920 | $27,920 |
| 2020 | $784 | $42,040 | $16,920 | $25,120 |
| 2019 | $473 | $39,360 | $6,680 | $32,680 |
| 2018 | $718 | $38,440 | $6,520 | $31,920 |
| 2017 | $267 | $16,160 | $4,840 | $11,320 |
| 2016 | $266 | $16,160 | $4,840 | $11,320 |
| 2015 | $369 | $16,160 | $4,840 | $11,320 |
| 2014 | $268 | $16,160 | $4,840 | $11,320 |
Source: Public Records
Map
Nearby Homes
