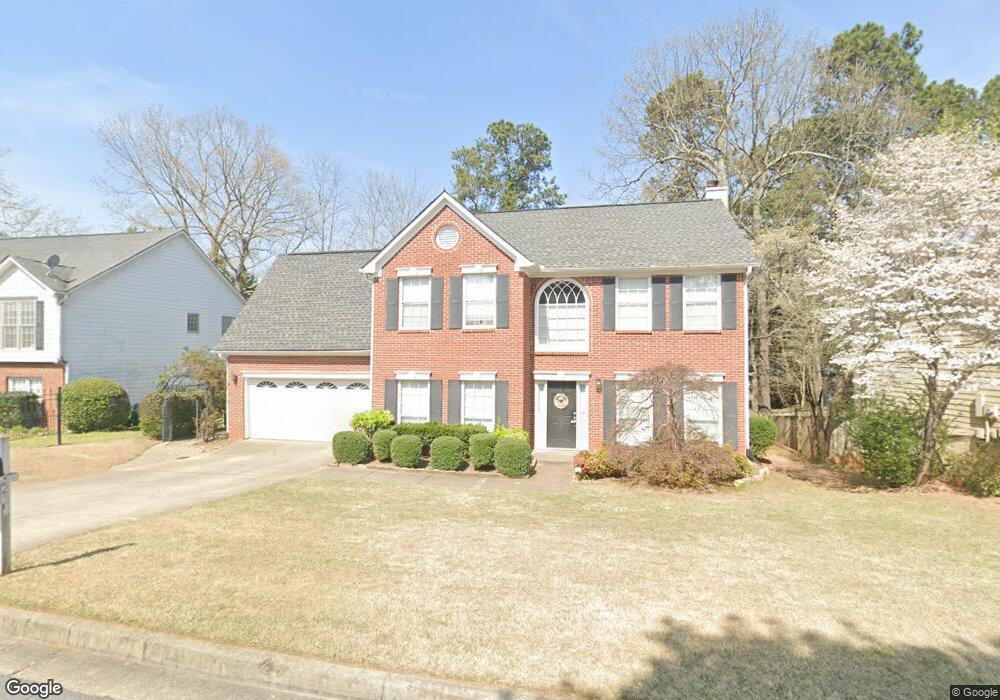
225 Boca Ciega Ct Alpharetta, GA 30022
Estimated Value: $516,000 - $558,000
4
Beds
3
Baths
1,886
Sq Ft
$282/Sq Ft
Est. Value
About This Home
This home is located at 225 Boca Ciega Ct, Alpharetta, GA 30022 and is currently estimated at $532,327, approximately $282 per square foot. 225 Boca Ciega Ct is a home located in Fulton County with nearby schools including State Bridge Crossing Elementary School, Taylor Road Middle School, and Chattahoochee High School.
Ownership History
Date
Name
Owned For
Owner Type
Purchase Details
Closed on
Oct 15, 2010
Sold by
Hud & Housing Of Urban Dev
Bought by
Vanlooy Heather E
Current Estimated Value
Purchase Details
Closed on
Mar 2, 2010
Sold by
Bac Home Loans Servicing Lp
Bought by
Hud & Housing Of Urban Dev
Purchase Details
Closed on
Jun 15, 2007
Sold by
Slack John B
Bought by
Ozkul Selda and Ozbek Ozgur
Home Financials for this Owner
Home Financials are based on the most recent Mortgage that was taken out on this home.
Original Mortgage
$242,782
Interest Rate
6.71%
Mortgage Type
FHA
Purchase Details
Closed on
Jan 27, 1994
Sold by
Newton Cynthia K
Bought by
Curson Cheri L
Home Financials for this Owner
Home Financials are based on the most recent Mortgage that was taken out on this home.
Original Mortgage
$92,000
Interest Rate
6.97%
Purchase Details
Closed on
Dec 29, 1993
Sold by
Atlanta Residential Const Inc
Bought by
Slack John B
Home Financials for this Owner
Home Financials are based on the most recent Mortgage that was taken out on this home.
Original Mortgage
$92,000
Interest Rate
6.97%
Create a Home Valuation Report for This Property
The Home Valuation Report is an in-depth analysis detailing your home's value as well as a comparison with similar homes in the area
Home Values in the Area
Average Home Value in this Area
Purchase History
| Date | Buyer | Sale Price | Title Company |
|---|---|---|---|
| Vanlooy Heather E | -- | -- | |
| Hud & Housing Of Urban Dev | -- | -- | |
| Bac Home Loans Servicing Lp | $268,207 | -- | |
| Ozkul Selda | $246,600 | -- | |
| Curson Cheri L | $115,000 | -- | |
| Slack John B | $134,400 | -- |
Source: Public Records
Mortgage History
| Date | Status | Borrower | Loan Amount |
|---|---|---|---|
| Previous Owner | Ozkul Selda | $242,782 | |
| Previous Owner | Curson Cheri L | $92,000 | |
| Previous Owner | Slack John B | $120,950 |
Source: Public Records
Tax History Compared to Growth
Tax History
| Year | Tax Paid | Tax Assessment Tax Assessment Total Assessment is a certain percentage of the fair market value that is determined by local assessors to be the total taxable value of land and additions on the property. | Land | Improvement |
|---|---|---|---|---|
| 2025 | $2,568 | $228,680 | $38,760 | $189,920 |
| 2023 | $5,014 | $177,640 | $31,440 | $146,200 |
| 2022 | $2,449 | $137,440 | $33,160 | $104,280 |
| 2021 | $2,418 | $121,320 | $27,440 | $93,880 |
| 2020 | $2,431 | $119,880 | $27,120 | $92,760 |
| 2019 | $296 | $117,760 | $26,640 | $91,120 |
| 2018 | $2,673 | $99,400 | $18,600 | $80,800 |
| 2017 | $2,373 | $82,040 | $12,800 | $69,240 |
| 2016 | $2,319 | $82,040 | $12,800 | $69,240 |
| 2015 | $2,307 | $80,440 | $12,800 | $67,640 |
| 2014 | $1,943 | $68,120 | $10,840 | $57,280 |
Source: Public Records
Map
Nearby Homes
- 5022 Anclote Dr
- 4965 Cinnabar Dr
- 4815 Tanners Spring Dr
- 5060 Cinnabar Dr
- 4965 N Bridges Dr
- 225 Morton Creek Cir
- 10840 Mortons Crossing
- 4740 Carversham Way
- 10906 Gallier St
- 130 Douglas Fir Ct Unit 1
- 4790 Roswell Mill Dr
- 220 Magnolia Tree Ct
- 465 Mikasa Dr
- 120 Donamere Ct
- 11150 Highfield Chase Dr
- 165 Morton Walk Dr Unit 1
- 5425 Taylor Rd Unit 2
- 230 Pinebridge Ct
- 11390 Ridge Hill Dr
- 11125 Linbrook Ln
- 0 Boca Ciega Ct Unit 7475463
- 0 Boca Ciega Ct Unit 8148858
- 0 Boca Ciega Ct Unit 7273014
- 0 Boca Ciega Ct Unit 8963373
- 0 Boca Ciega Ct Unit 7053158
- 0 Boca Ciega Ct
- 235 Boca Ciega Ct Unit 2
- 215 Boca Ciega Ct
- 215 Boca Ciega Ct Unit 2
- 4931 Anclote Dr
- 4941 Anclote Dr
- 230 Boca Ciega Ct
- 4951 Anclote Dr
- 4921 Anclote Dr
- 4921 Anclote Dr Unit 1
- 240 Boca Ciega Ct
- 245 Boca Ciega Ct Unit II
- 220 Boca Ciega Ct
- 4961 Anclote Dr
- 210 Boca Ciega Ct