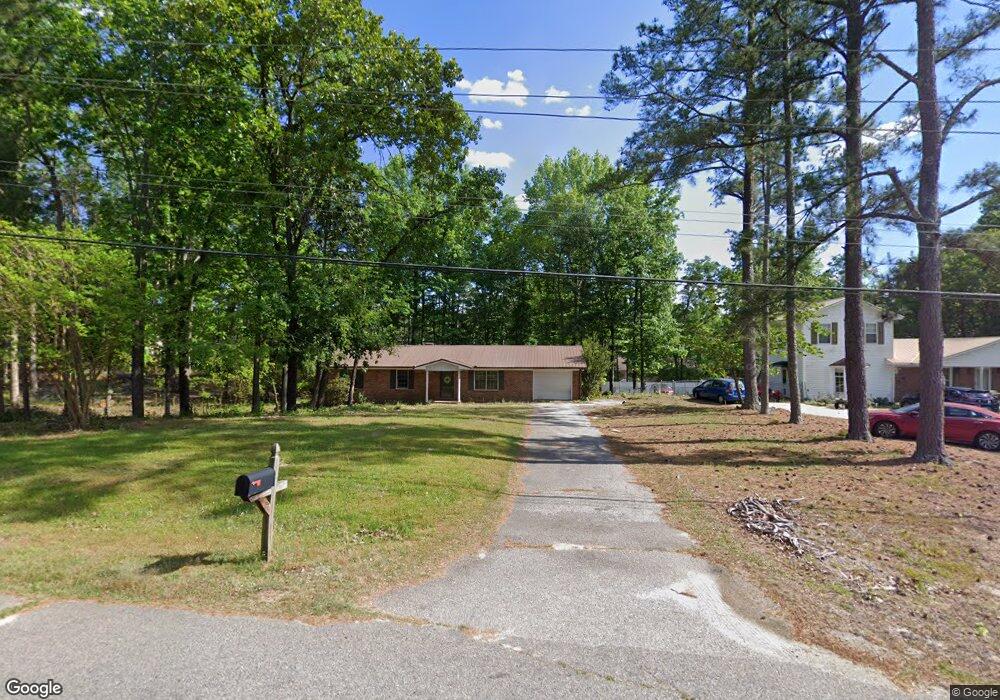
225 Bronwyn St Southern Pines, NC 28387
Estimated Value: $273,637 - $379,000
3
Beds
2
Baths
1,536
Sq Ft
$212/Sq Ft
Est. Value
About This Home
This home is located at 225 Bronwyn St, Southern Pines, NC 28387 and is currently estimated at $325,159, approximately $211 per square foot. 225 Bronwyn St is a home located in Moore County with nearby schools including Southern Pines Elementary, Southern Middle School, and Pinecrest High School.
Ownership History
Date
Name
Owned For
Owner Type
Purchase Details
Closed on
Jun 23, 2021
Sold by
Hubler David A and Hubler Kristin E
Bought by
Hubler David A and Hubler Kristin E
Current Estimated Value
Home Financials for this Owner
Home Financials are based on the most recent Mortgage that was taken out on this home.
Original Mortgage
$106,885
Outstanding Balance
$96,771
Interest Rate
2.9%
Mortgage Type
New Conventional
Estimated Equity
$228,388
Create a Home Valuation Report for This Property
The Home Valuation Report is an in-depth analysis detailing your home's value as well as a comparison with similar homes in the area
Home Values in the Area
Average Home Value in this Area
Purchase History
| Date | Buyer | Sale Price | Title Company |
|---|---|---|---|
| Hubler David A | -- | Westcor Land Title Ins Co | |
| Hubler David A | -- | None Listed On Document |
Source: Public Records
Mortgage History
| Date | Status | Borrower | Loan Amount |
|---|---|---|---|
| Open | Hubler David A | $106,885 | |
| Closed | Hubler David A | $106,885 |
Source: Public Records
Tax History Compared to Growth
Tax History
| Year | Tax Paid | Tax Assessment Tax Assessment Total Assessment is a certain percentage of the fair market value that is determined by local assessors to be the total taxable value of land and additions on the property. | Land | Improvement |
|---|---|---|---|---|
| 2024 | $1,444 | $188,190 | $35,000 | $153,190 |
| 2023 | $1,482 | $188,190 | $35,000 | $153,190 |
| 2022 | $1,408 | $138,750 | $24,000 | $114,750 |
| 2021 | $1,443 | $138,750 | $24,000 | $114,750 |
| 2020 | $1,457 | $138,750 | $24,000 | $114,750 |
| 2019 | $1,457 | $138,750 | $24,000 | $114,750 |
| 2018 | $1,253 | $128,500 | $18,500 | $110,000 |
| 2017 | $1,240 | $128,500 | $18,500 | $110,000 |
| 2015 | $1,176 | $128,500 | $18,500 | $110,000 |
| 2014 | $1,117 | $122,130 | $18,500 | $103,630 |
| 2013 | -- | $122,130 | $18,500 | $103,630 |
Source: Public Records
Map
Nearby Homes
- TBD Stephanie St
- 0 Stephanie St
- 1608 Crest Dr
- 1710 N Poplar St
- 1709 N Poplar St
- 822 Ducks Landing
- 161 Kensington Way
- 305 3rd St
- 901 Heather Trail
- 110 Cliff Ct
- 140 One Down St
- 624 Chambers
- 612 Chambers Dr
- 608 Chambers Dr
- 532 Burgundy Dr
- 613 Chambers Dr
- 509 Burgundy Dr
- Camargue Plan at Shaw Landing
- Grenoble Plan at Shaw Landing
- Hamel Plan at Shaw Landing