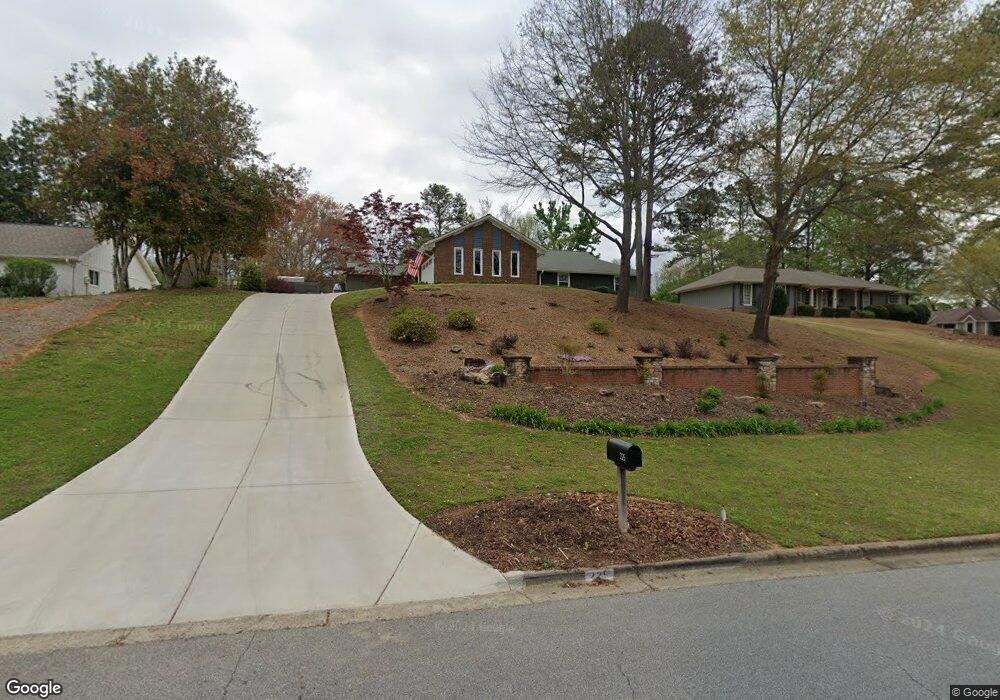
225 Brookfield Place Unit 11 Roswell, GA 30075
Brookfield West NeighborhoodEstimated Value: $712,000 - $806,000
4
Beds
3
Baths
2,598
Sq Ft
$293/Sq Ft
Est. Value
About This Home
This home is located at 225 Brookfield Place Unit 11, Roswell, GA 30075 and is currently estimated at $761,832, approximately $293 per square foot. 225 Brookfield Place Unit 11 is a home located in Fulton County with nearby schools including Mountain Park Elementary School, Crabapple Middle School, and Fulton Academy of Science and Technology.
Ownership History
Date
Name
Owned For
Owner Type
Purchase Details
Closed on
Sep 7, 2011
Sold by
Donehower Thomas Ross
Bought by
Hager Allison
Current Estimated Value
Home Financials for this Owner
Home Financials are based on the most recent Mortgage that was taken out on this home.
Original Mortgage
$268,028
Outstanding Balance
$184,593
Interest Rate
4.38%
Mortgage Type
FHA
Estimated Equity
$577,239
Purchase Details
Closed on
Dec 4, 1997
Sold by
Kemper Gary W
Bought by
Pinette George M and Pinette Mary Ellen
Home Financials for this Owner
Home Financials are based on the most recent Mortgage that was taken out on this home.
Original Mortgage
$148,000
Interest Rate
6.37%
Mortgage Type
New Conventional
Purchase Details
Closed on
Aug 15, 1994
Sold by
Lund William C
Bought by
Kemper Gary W
Home Financials for this Owner
Home Financials are based on the most recent Mortgage that was taken out on this home.
Original Mortgage
$100,000
Interest Rate
7.12%
Create a Home Valuation Report for This Property
The Home Valuation Report is an in-depth analysis detailing your home's value as well as a comparison with similar homes in the area
Home Values in the Area
Average Home Value in this Area
Purchase History
| Date | Buyer | Sale Price | Title Company |
|---|---|---|---|
| Hager Allison | $275,000 | -- | |
| Pinette George M | $185,000 | -- | |
| Kemper Gary W | $168,000 | -- |
Source: Public Records
Mortgage History
| Date | Status | Borrower | Loan Amount |
|---|---|---|---|
| Open | Hager Allison | $268,028 | |
| Previous Owner | Pinette George M | $148,000 | |
| Previous Owner | Kemper Gary W | $100,000 |
Source: Public Records
Tax History Compared to Growth
Tax History
| Year | Tax Paid | Tax Assessment Tax Assessment Total Assessment is a certain percentage of the fair market value that is determined by local assessors to be the total taxable value of land and additions on the property. | Land | Improvement |
|---|---|---|---|---|
| 2025 | $1,112 | $226,880 | $54,160 | $172,720 |
| 2023 | $5,347 | $189,440 | $48,160 | $141,280 |
| 2022 | $4,123 | $156,720 | $46,800 | $109,920 |
| 2021 | $4,268 | $134,000 | $40,640 | $93,360 |
| 2020 | $4,592 | $140,240 | $59,320 | $80,920 |
| 2019 | $700 | $141,200 | $50,720 | $90,480 |
| 2018 | $3,893 | $137,920 | $49,560 | $88,360 |
| 2017 | $3,290 | $112,760 | $29,840 | $82,920 |
| 2016 | $3,291 | $112,760 | $29,840 | $82,920 |
| 2015 | $3,919 | $112,760 | $29,840 | $82,920 |
| 2014 | $2,929 | $95,560 | $26,000 | $69,560 |
Source: Public Records
Map
Nearby Homes
- 120 Cedarwood Ln
- 140 Cedarwood Ln
- 130 Cedarwood Ln
- 12620 Old Surrey Place
- 160 Cedarwood Ln
- 150 Cedarwood Ln
- 235 Winterberry Way
- 180 Cedarwood Ln
- 4010 Rockingham Dr
- 5045 Rockingham Dr
- 12555 Sibley Ln
- 110 Ansley Way
- 870 Hickory Oak Hollow
- 13565 Wood Fern Way
- 13585 Wood Fern Way
- 515 Kent Rd
- 865 Ferncroft Ct
- 680 Brookfield Pkwy Unit 1
- 915 Ebenezer Rd
- 140 E Lake Dr
- 235 Brookfield Place
- 215 Brookfield Place
- 120 Brooks Glen Unit 11
- 110 Brooks Glen
- 220 Brookfield Place
- 245 Brookfield Place Unit 11
- 130 Brooks Glen Unit 11
- 210 Brookfield Place
- 230 Brookfield Place
- 12485 Silver Fox Ct
- 105 Brookfield Hollow Unit 57
- 105 Brookfield Hollow
- 240 Brookfield Place
- 0 Silver Fox Ct Unit 7161832
- 0 Silver Fox Ct Unit 7084056
- 0 Silver Fox Ct Unit 3172745
- 0 Silver Fox Ct Unit 8561360
- 0 Silver Fox Ct Unit 8536611
- 0 Silver Fox Ct Unit 7637168
- 0 Silver Fox Ct Unit 3237363