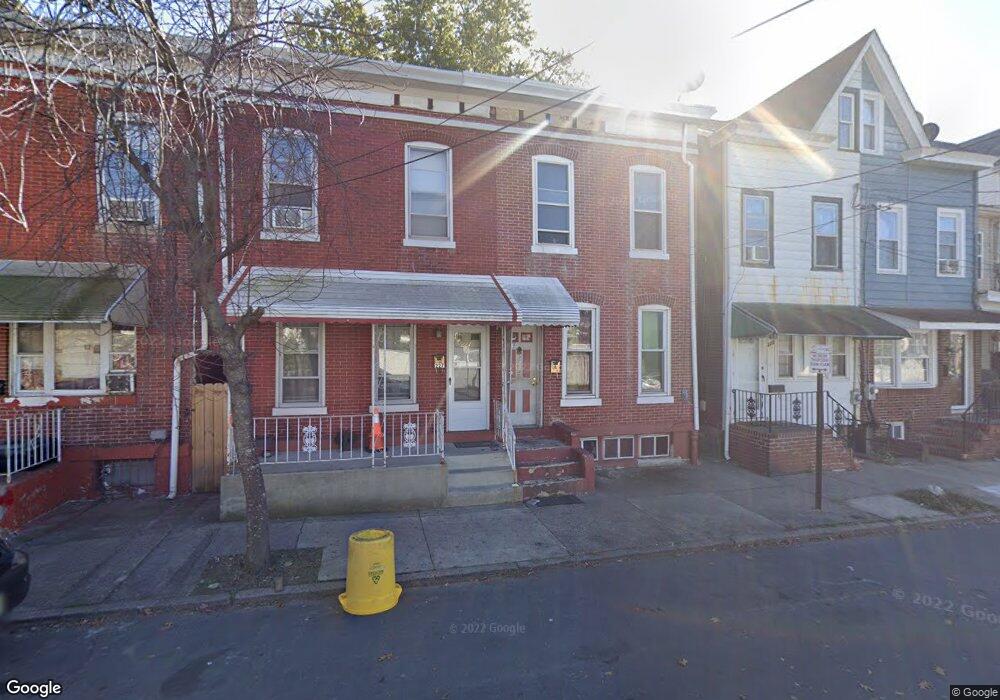
225 Butler St Trenton, NJ 08611
Chambersburg NeighborhoodEstimated Value: $206,000 - $246,000
--
Bed
--
Bath
1,445
Sq Ft
$151/Sq Ft
Est. Value
About This Home
This home is located at 225 Butler St, Trenton, NJ 08611 and is currently estimated at $218,550, approximately $151 per square foot. 225 Butler St is a home located in Mercer County with nearby schools including Robbins Elementary School, Monument Elementary School, and Dr. Martin Luther King Middle School.
Ownership History
Date
Name
Owned For
Owner Type
Purchase Details
Closed on
May 24, 2007
Sold by
Panton Steve
Bought by
Luecke Hendrik and Owzar Kiana
Current Estimated Value
Purchase Details
Closed on
Jun 29, 2000
Sold by
Rivera Wilfredo
Bought by
Panton Steve and Santiago Francisco
Home Financials for this Owner
Home Financials are based on the most recent Mortgage that was taken out on this home.
Original Mortgage
$66,965
Interest Rate
8.28%
Mortgage Type
FHA
Create a Home Valuation Report for This Property
The Home Valuation Report is an in-depth analysis detailing your home's value as well as a comparison with similar homes in the area
Home Values in the Area
Average Home Value in this Area
Purchase History
| Date | Buyer | Sale Price | Title Company |
|---|---|---|---|
| Luecke Hendrik | $299,000 | -- | |
| Panton Steve | $67,000 | -- |
Source: Public Records
Mortgage History
| Date | Status | Borrower | Loan Amount |
|---|---|---|---|
| Previous Owner | Panton Steve | $66,965 |
Source: Public Records
Tax History Compared to Growth
Tax History
| Year | Tax Paid | Tax Assessment Tax Assessment Total Assessment is a certain percentage of the fair market value that is determined by local assessors to be the total taxable value of land and additions on the property. | Land | Improvement |
|---|---|---|---|---|
| 2025 | $3,266 | $56,300 | $8,900 | $47,400 |
| 2024 | $3,134 | $56,300 | $8,900 | $47,400 |
| 2023 | $3,134 | $56,300 | $8,900 | $47,400 |
| 2022 | $3,073 | $56,300 | $8,900 | $47,400 |
| 2021 | $3,126 | $56,300 | $8,900 | $47,400 |
| 2020 | $3,116 | $56,300 | $8,900 | $47,400 |
| 2019 | $3,066 | $56,300 | $8,900 | $47,400 |
| 2018 | $2,935 | $56,300 | $8,900 | $47,400 |
| 2017 | $2,790 | $56,300 | $8,900 | $47,400 |
| 2016 | $3,935 | $68,400 | $17,700 | $50,700 |
| 2015 | $3,921 | $68,400 | $17,700 | $50,700 |
| 2014 | $3,903 | $68,400 | $17,700 | $50,700 |
Source: Public Records
Map
Nearby Homes