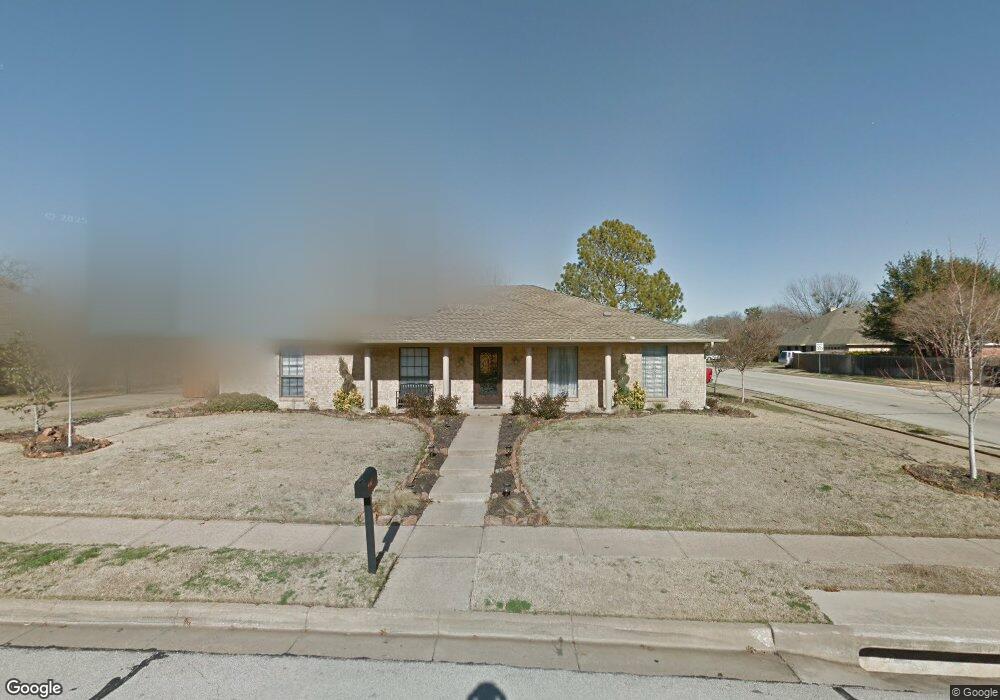
225 Carolyn Dr Bedford, TX 76021
Estimated Value: $380,000 - $445,000
3
Beds
2
Baths
1,955
Sq Ft
$205/Sq Ft
Est. Value
About This Home
This home is located at 225 Carolyn Dr, Bedford, TX 76021 and is currently estimated at $401,684, approximately $205 per square foot. 225 Carolyn Dr is a home located in Tarrant County with nearby schools including Bedford Heights Elementary School, Bedford Junior High School, and L.D. Bell High School.
Ownership History
Date
Name
Owned For
Owner Type
Purchase Details
Closed on
May 24, 2019
Sold by
Swenson Eric and Swenson Kelly
Bought by
The Swenson Family Trust
Current Estimated Value
Purchase Details
Closed on
Sep 20, 2018
Sold by
Katkic Robert J
Bought by
Swenson Eric and Swenson Kelly
Purchase Details
Closed on
Oct 3, 2003
Sold by
Roberts Jeffrey G and Roberts Tera L
Bought by
Katkic Robert
Home Financials for this Owner
Home Financials are based on the most recent Mortgage that was taken out on this home.
Original Mortgage
$100,000
Interest Rate
6.25%
Mortgage Type
Purchase Money Mortgage
Purchase Details
Closed on
Dec 20, 1996
Sold by
Novak Elizabeth H
Bought by
Roberts Jeffrey G and Roberts Tera L
Home Financials for this Owner
Home Financials are based on the most recent Mortgage that was taken out on this home.
Original Mortgage
$117,150
Interest Rate
7.6%
Mortgage Type
VA
Create a Home Valuation Report for This Property
The Home Valuation Report is an in-depth analysis detailing your home's value as well as a comparison with similar homes in the area
Home Values in the Area
Average Home Value in this Area
Purchase History
| Date | Buyer | Sale Price | Title Company |
|---|---|---|---|
| The Swenson Family Trust | -- | None Available | |
| Swenson Eric | -- | Providence Title Co | |
| Katkic Robert | -- | Fidelity Natl Title Agency | |
| Roberts Jeffrey G | -- | American Title Company |
Source: Public Records
Mortgage History
| Date | Status | Borrower | Loan Amount |
|---|---|---|---|
| Previous Owner | Katkic Robert | $100,000 | |
| Previous Owner | Roberts Jeffrey G | $117,150 |
Source: Public Records
Tax History Compared to Growth
Tax History
| Year | Tax Paid | Tax Assessment Tax Assessment Total Assessment is a certain percentage of the fair market value that is determined by local assessors to be the total taxable value of land and additions on the property. | Land | Improvement |
|---|---|---|---|---|
| 2025 | $3,767 | $364,236 | $75,000 | $289,236 |
| 2024 | $3,767 | $364,236 | $75,000 | $289,236 |
| 2023 | $6,774 | $367,869 | $55,000 | $312,869 |
| 2022 | $7,012 | $325,470 | $55,000 | $270,470 |
| 2021 | $6,875 | $291,878 | $55,000 | $236,878 |
| 2020 | $6,327 | $266,125 | $55,000 | $211,125 |
| 2019 | $6,744 | $277,594 | $55,000 | $222,594 |
| 2018 | $4,869 | $216,154 | $55,000 | $161,154 |
| 2017 | $4,754 | $214,704 | $18,000 | $196,704 |
| 2016 | $4,322 | $200,522 | $18,000 | $182,522 |
| 2015 | $3,803 | $162,400 | $18,000 | $144,400 |
| 2014 | $3,803 | $162,400 | $18,000 | $144,400 |
Source: Public Records
Map
Nearby Homes
- 320 Blue Quail Ct
- 432 Sunnybrook Ct
- 305 Warbler Dr
- 121 Kay Ct
- 124 Jeannie Ct
- 3213 Spring Valley Dr
- 1732 Jeannie Ln
- 405 Woodbriar Ct
- 3119 Spring Grove Dr
- 404 Heather Ln
- 421 Cavender Ct
- 2212 Mountainview Dr
- 817 Shady Lake Dr
- 801 Shady Creek Ln
- 1740 Brown Trail
- 2212 Hurstview Dr
- 3605 Spring Valley Dr
- 2436 Brookgreen Ct
- 2244 Hurstview Dr
- 922 Shady Creek Ln
- 221 Carolyn Dr
- 212 Norfolk Dr
- 301 Carolyn Dr
- 208 Norfolk Dr
- 217 Carolyn Dr
- 224 Carolyn Dr
- 300 Norfolk Ct
- 220 Carolyn Dr
- 204 Norfolk Dr
- 305 Carolyn Dr
- 300 Carolyn Dr
- 216 Carolyn Dr
- 304 Norfolk Ct
- 3000 Shenandoah Dr
- 3004 Shenandoah Dr
- 304 Carolyn Dr
- 213 Norfolk Dr
- 212 Carolyn Dr
- 309 Carolyn Dr
- 209 Norfolk Dr