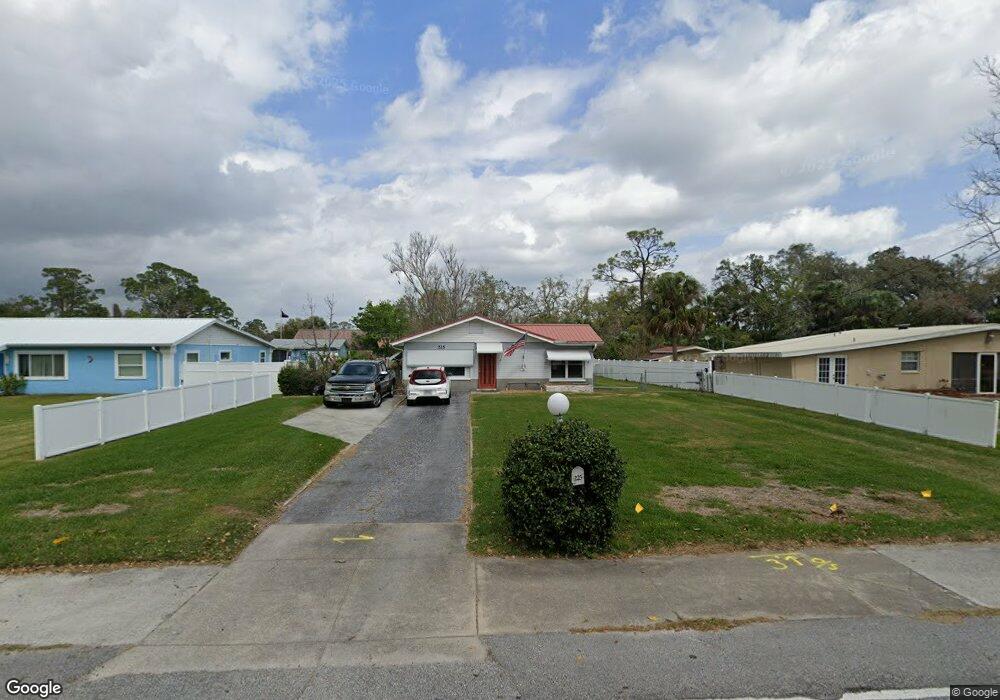
225 Charles St Port Orange, FL 32129
Estimated Value: $230,000 - $249,000
2
Beds
1
Bath
1,264
Sq Ft
$189/Sq Ft
Est. Value
About This Home
This home is located at 225 Charles St, Port Orange, FL 32129 and is currently estimated at $239,419, approximately $189 per square foot. 225 Charles St is a home located in Volusia County with nearby schools including Sugar Mill Elementary School, Silver Sands Middle School, and Spruce Creek High School.
Ownership History
Date
Name
Owned For
Owner Type
Purchase Details
Closed on
Nov 22, 2016
Sold by
Potts Wilford J and Fisher Joyce K
Bought by
Potts Wilford J and Fisher Joyce K
Current Estimated Value
Home Financials for this Owner
Home Financials are based on the most recent Mortgage that was taken out on this home.
Original Mortgage
$204,000
Outstanding Balance
$169,442
Interest Rate
4.57%
Mortgage Type
Reverse Mortgage Home Equity Conversion Mortgage
Estimated Equity
$69,977
Purchase Details
Closed on
Oct 26, 2016
Sold by
Potts Wilford J and Fisher Joyce
Bought by
Potts Wilford J and Fisher Joyce
Home Financials for this Owner
Home Financials are based on the most recent Mortgage that was taken out on this home.
Original Mortgage
$204,000
Outstanding Balance
$169,442
Interest Rate
4.57%
Mortgage Type
Reverse Mortgage Home Equity Conversion Mortgage
Estimated Equity
$69,977
Purchase Details
Closed on
Jun 15, 1984
Bought by
Potts Wilford J
Purchase Details
Closed on
Jan 15, 1976
Bought by
Potts Wilford J
Create a Home Valuation Report for This Property
The Home Valuation Report is an in-depth analysis detailing your home's value as well as a comparison with similar homes in the area
Home Values in the Area
Average Home Value in this Area
Purchase History
| Date | Buyer | Sale Price | Title Company |
|---|---|---|---|
| Potts Wilford J | -- | Fidelity Natl Title Ins Co | |
| Potts Wilford J | -- | None Available | |
| Potts Wilford J | $52,000 | -- | |
| Potts Wilford J | $25,000 | -- |
Source: Public Records
Mortgage History
| Date | Status | Borrower | Loan Amount |
|---|---|---|---|
| Open | Potts Wilford J | $204,000 |
Source: Public Records
Tax History Compared to Growth
Tax History
| Year | Tax Paid | Tax Assessment Tax Assessment Total Assessment is a certain percentage of the fair market value that is determined by local assessors to be the total taxable value of land and additions on the property. | Land | Improvement |
|---|---|---|---|---|
| 2025 | $768 | $83,443 | -- | -- |
| 2024 | $768 | $81,092 | -- | -- |
| 2023 | $768 | $78,731 | $0 | $0 |
| 2022 | $718 | $76,438 | $0 | $0 |
| 2021 | $723 | $74,212 | $0 | $0 |
| 2020 | $714 | $73,187 | $0 | $0 |
| 2019 | $704 | $71,542 | $0 | $0 |
| 2018 | $711 | $70,208 | $0 | $0 |
| 2017 | $721 | $68,764 | $0 | $0 |
| 2016 | $720 | $67,350 | $0 | $0 |
| 2015 | $742 | $66,882 | $0 | $0 |
| 2014 | $748 | $66,351 | $0 | $0 |
Source: Public Records
Map
Nearby Homes
- 310 Legion Place
- 0 S Ridgewood Ave
- 315 Herbert St
- 218 Herbert St
- 403 Herbert St
- 3344 S Ridgewood Ave
- 948 Orange Ave
- 3333 S Ridgewood Ave Unit 9
- 3333 S Ridgewood Ave Unit 8
- 312 Dunlawton Ave
- 48 Valley St
- 908 3rd St
- 1025 2nd St
- 827 Railroad St
- 1022 4th St
- 904 Charles St
- 1021 5th St
- 1023 5th St
- 1025 5th St
- 532 Lafayette St
- 301 Charles St
- 223 Charles St
- 303 Charles St
- 912 Lafayette St
- 302 Charles St
- 305 Charles St
- 914 Lafayette St
- 211 Willis St
- 217 Charles St
- 911 Lafayette St
- 216 Ocean Ave
- 301 Legion Place
- 220 Ocean Ave
- 218 Ocean Ave
- 306 Charles St
- 309 Charles St
- 305 Legion Place
- 300 Ocean Ave
- 209 Willis St
- 311 Charles St